by John Butcher
It’s Spring! The Narcissi are standing tall and promising blossoms. The Croci are in flower. Data are sprouting in last year’s Superintendent’s Annual Report.
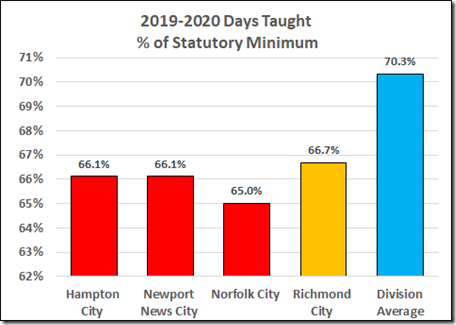
Table 8, “Number of Days Taught, ADA, ADM,” gives us an early measure of the impact of the pandemic-related shutdowns on school attendance.
The City of Richmond’s end-of-year count of days taught was 120, just two-thirds of the statutory minimum. Richmond’s total was one day more than those of Hampton and Newport News, three days more than Norfolk, and 6.6 days short of the division average.
The highest in the state was Buckingham, 139 days; the lowest was Galax, 112.
Table 8 also shows end-of-year attendance data for the elementary and secondary schools. Richmond and all the peer cities managed to exacerbate the impact of the pandemic.

The division with the highest average attendance was Falls Church with 96.4%. Lowest was Petersburg, 91.3%.
These data do not give us a picture of the number of days or attendance of any on-line schooling.
Of course, these numbers are but a warmup for the 2020-2021 shutdowns.
It appears that this year’s SOL testing will be voluntary so we’ll have to wait until the summer of 2022 for a measure of the impact of all this.