
more move to red states, and red counties in blue states.
From Issues & Insights:
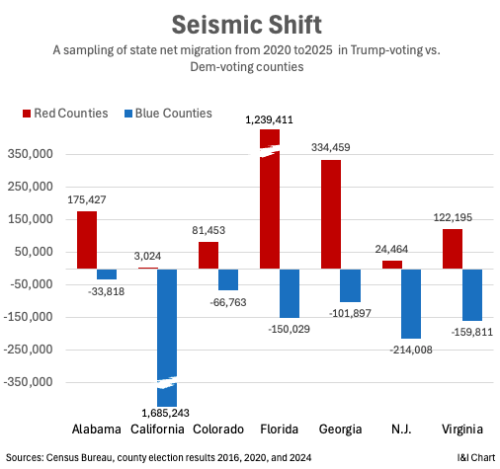
The past five years have seen a massive migration of Americans out of heavily Democratic counties and into ones where Donald Trump won majorities in each of the past three elections. … Most analyses of internal migration patterns look only at state-level data. And what they show is that blue states are losing population to red states, and have been for many years.
I&I wanted to go deeper, so we used the latest Census data on migration between counties, and compared that with how these counties voted in the past three presidential elections. What we found was that millions aren’t just moving out of blue states, but are moving out of blue counties within states.
Virginia’s blue counties lost nearly 160,000 to net migration, while its solidly red ones gained more than 122,000
Leave a Reply
You must be logged in to post a comment.