
by Steve Haner
Is Virginia really the number one importer of electricity, the state most dependent upon others to keep the lights on and the servers humming? Yes and no.
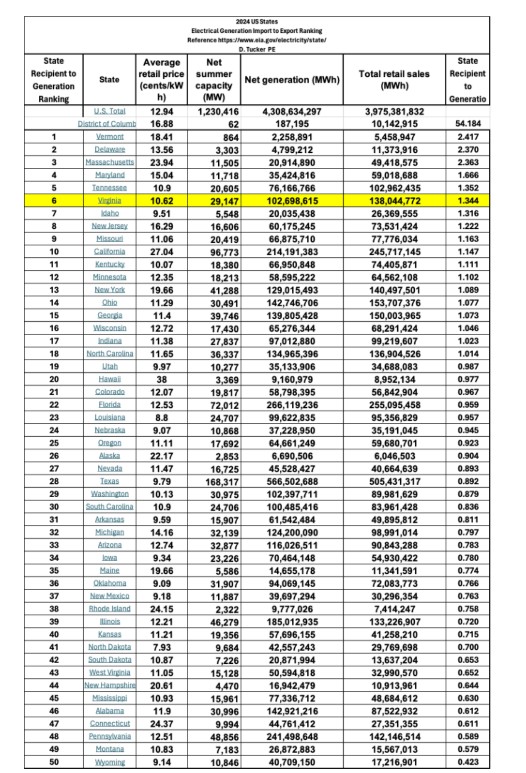
The go-to source of data on the electricity industry (and other energy industries) is the federal Energy Information Agency, or EIA. EIA data shows Virginia had the dubious distinction in 2024 of being the state with the widest disparity between the amount of electricity produced within its borders and the amount electricity used by its consumers, a shortage of 35 million megawatt hours (MWh).
As noted in yesterday’s post on the gas plant lawsuit, as a percentage of total electricity sales, five other states and the District of Columbia had even larger electricity deficits. Virginia being number 7 out of 51 on a percentage basis is hardly good news, either.
The quick assumption (and I made it, too) is that those data indicate that Virginia imported 35 million MWh in 2024, but the EIA data shows our full import total in 2024 was 45 million MWh. When you look at the EIA full tally of imports, California is the state with the largest volume of electricity brought in from other locations (including Mexico in California’s case).
But the political narrative that we are the largest importer is deeply embedded now, without any nuance. Perhaps the nuance doesn’t matter. Virginia was the most dependent on imports to serve Virginia residents, but not the largest importer.
As you will read below, that deep deficit is more than three decades old. Virginia remains electricity poor and the gap is probably wider now than in 2024.
How can California be the largest importer of electricity, yet have a smaller deficit than Virginia when generation is compared to retail consumption (about 31 million MWh)? California uses substantially more electricity in the production of power; 13 million MWh compared to Virginia’s 2.5 million MWh. It also has greater power losses; 11.5 million MWh compared to Virginia’s 6.4 million MWh. Are those results of California’s greater reliance on wind and solar?
All the data from the various states is buried in the hundreds of EIA spreadsheets, but for the comparisons somebody must do some database building. The list of the states for 2024 you can see here and below comes from a retired engineer, David Tucker, who is a regular participant in the State Corporation Commission’s application reviews and has shared his work with Bacon’s Rebellion before.
He labeled it imports versus exports, but more accurately it shows state deficits versus surpluses. Most of the states, as you can see, showed surplus generation in 2024.
Here is an insight from his table of energy deficits that neither the EIA nor Tucker provided. The District and four of the five states with even deeper energy deficits than Virginia on a percentage basis are members of the Regional Greenhouse Gas Initiative. Only four of the eleven RGGI states are in surplus, and the RGGI members with sufficient generation include the tiniest (New Hampshire and Rhode Island.)
Looking at a logical regional combination, Virginia, the District, Maryland and Delaware (the DMV+D) combined used 65 million megawatts of electricity generated elsewhere in 2024. All four neighbors were deeply dependent on other states within the PJM Interconnection region which are not hamstrung by legal constraints on coal and gas generation (West Virginia and Pennsylvania leading the pack).
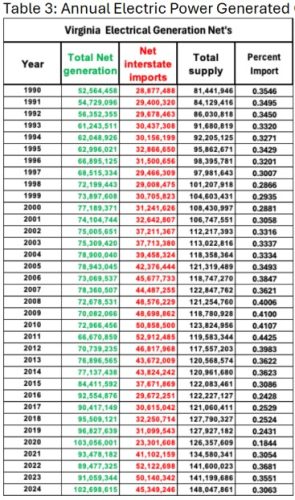
Tucker pulled the data from past years of reports to show Virginia’s history of importing or exporting back to 1990, shared above. If any political or environmental talking head tries to claim the import issue is due to the data centers, this table blows up that lie. Virginia’s import dependence in the early 1990s was basically the same as in the early 2020s. The state was “net short” in all 35 years.
The completion of several large natural gas plants by Dominion Energy Virginia in the 2010s did lower the level of dependence for a while. Then in 2021, 2022 and 2023 the import percentage shot up again, to more than 50 million MWh. The reason is obvious, but Virginia Democrats won’t face this truth: being in the RGGI compact those three years shuttered Virginia’s internal generation, forcing more imports. If there was another factor, it was Dominion retiring many of its coal-fired plants those years (also something EIA tracks).
Virginia dropped out of RGGI in 2024 and as bad as that year was, the imports were smaller than in the three previous years. We are, of course, back in RGGI starting next month.
In response to questions about the proposed acquisition of Dominion by Florida-based NextEra Energy, Tucker compiled a comparison of Florida, Virginia and South Carolina, which also has a Dominion electric utility in part of it territory. Florida and South Carolina are among the states with generation exceeding retail demand, but Florida in 2024 did import some electricity. South Carolina was able to export almost 10 million MWh.
The EIA state profile report on individual states has real depth, with 20 different tables. Start with this webpage, which has the basic data on both generation and sales within the state. But then click on the state you want (say Virginia) for more data.
But the gold mine is found deeper on that page, where you are invited to open and examine the package of 19 data tables on each state. I loaded Virginia’s Excel file on the Bacon’s Rebellion server for you to access here. The import-export data, for example, is Table 10. Careful, it is addictive. The full compilation of 2025 data is not due to be released until November.
Leave a Reply
You must be logged in to post a comment.