by John Butcher
The 2025 SOL data are up on the VDOE Web site. This post looks at the statewide data.
But First: VDOE reports pass rate averages for “economically disadvantaged” students (“ED” here, mostly those who qualify for free/reduced price meals), their more affluent peers (“Not ED”), and all students. ED students generally perform less well than the Not ED, see below. Most reports and, it appears, the new Accreditation system look at the all-students averages. That serves to unfairly penalize the divisions with large ED populations. A fair system would look at both groups and probably would emphasize the performance of the group that needs more attention, the ED. This post looks at the ED and Not ED data in addition to those for all students.
VDOE scores SOL pass rates on a 600-point scale. Scores above 500 are counted as Pass/Advanced. Those from 400 to 500, Pass/Proficient. The sum of those two rates in the overall pass rate. Note: The Board of “Education” lowered the cut scores to the current levels in 2020, creating modest uncertainty in the calculation of the pandemic’s effects. Topic for another day: As set out in the document at that link, Virginia reports proficiency at rates roughly double those published by the NAEP.
The 2021 testing was voluntary so that year’s data surely are not reliable measures. I’ve omitted them here.
The Big Two subjects for Accreditation (and, probably, for functioning in life) are reading and math. To a lesser degree, the accreditation process considers the science pass rates. For reasons that will become obvious, I’ll start with math.
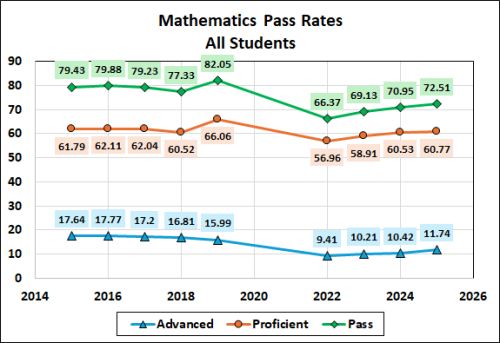
Here are the 2015 to 2025 state average pass rates for the mathematics tests. The Board of “Education” relaxed the math standards in 2019, hence the bump in pass rates that year.