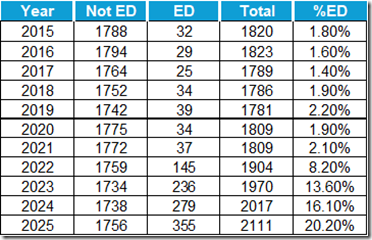
Increased enrollment of economically disadvantaged students seems to have had only a minor impact on academic performance.
by John Butcher
Responding to discussions (here, here, here, and here) of a new admissions policy and a decline in the US News ranking of TJ (aka Fairfax County’s Thomas Jefferson School for Science and Technology), I posted an analysis of the end-of-year test (“SOL”) data through 2025. Since then, I’ve had a chance to try to think more clearly (says he), with the following results.
But first: VDOE reports pass rate averages for “economically disadvantaged” students (“ED” here)(mostly those who qualify for free/reduced price meals, i.e., this is the bureaucratic euphemism for “poorer”), their more affluent peers (“Not ED”), and all students. ED students generally perform less well than the Not ED, see, e.g., this. Most of the VDOE reports and, it appears, the new Accreditation system (and, also, the US News rankings, see below) look at the all students averages. That serves to unfairly penalize the schools and divisions with large ED populations (and to benefit those, such as TJ, with a small ED group). A fair system would look at both groups and probably would emphasize the performance of the group that needs more attention, the ED. This post looks at the recent ED and Not ED data for TJ, in addition to the all students results.
VDOE scores SOL tests on a 600 point scale. Passing is 400. As well, there are two “pass” classifications. Scores above 500 are counted as Pass/Advanced; those from 400 to 500, Pass/Proficient. The sum of those two rates in the overall pass rate.
The 2021 testing was voluntary so that year’s data surely are not reliable measures. I’ve omitted them here.
To start, a helpful VDOE database gives us the “Fall Membership.” Here is the dataset for TJ: