
by Matt Hurt

In December JLARC released a report on the School Performance and Support Framework (SPSF), Virginia’s new accountability system. The report states that the new system is better than the old Accreditation system, but improvements are needed. From the perspective of an educator who has spent the last twenty years focusing on student outcomes and accountability, I largely agree with the report. The following are some facets of the system that should be reviewed and hopefully improved.
Complexity
I used to believe that the old Accreditation system (our previous accountability system) was extremely convoluted. However, compared to the SPSF, I would now consider the old Accreditation system the model of simplicity.
Under the old Accreditation system, there were only a few things that were calculated differently among schools by level (elementary, middle, or high school), namely graduation rates, college and career readiness, and growth. Given that there was no summative score for each school, there was more inherent simplicity. There were thresholds for each of those categories to identify schools for overall support, and there were predetermined thresholds for subgroup performance for federal accountability purposes that everyone knew prior to beginning the school year.
To calculate the new SPSF system results, all of the indicator data (mastery, growth, readiness, and graduation) must be aggregated into a single school performance score. There are different indicator weights for each of these based on the level of the school- elementary, middle, or high school. Not all schools fit into the traditional school categories (K-5 elementary, 6-8 middle, and 9-12 high schools) which further complicates this process. What courses are taught at the school, whether or not the school has a graduating class, whether or not the school has eighth graders, and whether or not the school has at least fifteen English Learners all combine to determine the weighting of each of the indicators. To understand all of this is a major undertaking for our division accountability directors/coordinators, not to mention our principals who have more pressing concerns on a daily basis.
The fact that there are different indicator weights based on school configuration is a level of complexity that cannot be overstated. For example, there have been so many scenarios that have arisen that it is unlikely that every possible scenario could have been reasonably foreseen from the beginning. VDOE staff have held weekly accountability meetings for school division staff to attend through which many outlier scenarios have been presented to VDOE staffers. Once they learn about a given scenario folks at VDOE have had to figure out how to account for the anomaly in that school’s accountability calculation. his process usually requires additional business rules to be created to account for those scenarios.
Another level of complexity added was the process of data collection. Student level data is used to determine which students are to be included in the SPSF calculation. For example, students who are enrolled in a school for less than 50% of the school year are not necessarily included. Similarly, English Learners are to be excluded for the first year in which they attend school in our country.
Under the old Accreditation system, all of the coding for student level data was entered by school and division assessment personnel directly into the Pearson assessment system. Before division directors of testing signed and submitted their “Authority to Report” verification (document that signaled to VDOE that all of the SOL data was accurate and was ready to be reported publicly as well as used to calculate Accreditation ratings), data could be downloaded from Pearson and double checked for accuracy.
Under the new SPSF system, these student level data points are not collected from the Pearson assessment system, but rather from the data reported to VDOE throughout the year, typically by division student information systems personnel. Given the fact that the data now is compiled from multiple sources, verifying the accuracy of data is more complex. Also, some of the data collection deadlines are scheduled for about a month after the “Authority to Report” verification deadline.
To calculate a school’s SPSF score, one must conduct a number of mathematical operations. To say that it is an index of an index of an index is not too far from the truth. The problem with this is that the system is not at all intuitive. One cannot look at a single indicator and make any determination of what the overall score will likely be. One cannot review a table of all of the indicator values and intuit whether the results are good or bad. This complexity effectively creates a significant barrier to transparency for educators.
Transparency
The SPSF seems to be relatively transparent for our constituency in that it provides a descriptive, summative evaluation of the outcomes of each school across the Commonwealth. Based on the 2025 school year results, approximately 23% of schools were rated as Distinguished, 43% On Track, 22% Off Track, and 12% Needs Intensive Support. The Virginia Department of Education’s School Quality Profiles site seems to report this information in a manner that most folks should be able to understand.
However, at the granular level, the SPSF is not as transparent to educators. School and division leaders across the state are still not entirely sure how all of this works, despite the best efforts of VDOE staff to keep everyone in the loop.
First, there is no currently available document that explains all of the rules for calculating the scores which include all of the specifics. General information is available, but that information is not sufficient to account for all of the multiple scenarios that could arise based on specific school and student circumstances. In other words, a reasonably capable person would likely not be able to accurately calculate each school’s accountability score for any scenario simply by referring to documentation that is currently available.
Second, the Virginia Board of Education (BOE) formally approved the School Performance and Support Framework at its August 28, 2024 board meeting. At that time, educators believed that everything was set and we would be provided with all of the information necessary to fully understand the new system. However, there are three different levels (the regulatory process, BOE action in addition to the regulatory process, and business rules determined by VDOE staff) of decision making in this process. The regulatory changes were finalized at that meeting, but there were a number of other changes that have taken place since then via BOE action and VDOE business rule changes. Despite the fact these changes were within the regulatory guidelines, those guidelines were rather broad, so changes could be significant.
The changes that continued to be made for the next year and a half were very difficult to track largely because the information was not readily available to school and division leaders. Our colleagues would meet with others across the state on a fairly frequent basis to compare notes on who heard what from whom to try to piece together what this accountability process looked like at that point in time.
By the time divisions received their final reports in December, we still had not yet received a document which fully explained all of the rules for calculating the accountability statistics. VDOE had provided overall school numbers to divisions in October, but this did not include aggregated subgroup results which were used to federally identify schools for “support” (which also lowered school accountability designations). School and division leaders were not made aware of the thresholds for identifying schools based on their subgroup performance until after the final reports were available in December.
Third, the thresholds to determine whether or not schools are identified for support based on their subgroup performance (and subsequently lowered a performance level if they are) are not determined until after all of the data is collected. This was a particular problem last school year as no one knew exactly how subgroup scores would be calculated and had no frame of reference for what those thresholds may be. The thresholds are expected to be recalculated each year, so while we will have an idea of our target, we won’t know precisely what that target is until schools receive their final ratings.
To be fair, the development of the SPSF algorithms was certainly exacerbated by the sheer complexity of the new accountability system. It does appear that staff at the VDOE exhibited due diligence to find a solution when presented by the anomalies caused by different scenarios that would have been difficult if not impossible to foresee. This process likely contributed to the ever-changing movement of the goalposts in this process.
Parity
Based on the data from our new SPSF system, if you want your school to be distinguished, your best bet is to make sure it is a high school (Table 1). In this system, high schools enjoy a number of advantages that are not available to elementary and middle schools which certainly impacts these numbers.

The first advantage enjoyed by high schools is the Three-E indicator (Enrollment, Enlistment, and Employment) which is not applicable at the elementary or middle level. Data from each of these categories is stacked, and the more boxes a student checks the more points the school gets. In the calculation, high schools are actually able to earn more than one hundred percent of the points possible in this indicator, based on how the BOE/VDOE set up the numerator and denominator.
Much of the Three-E indicator is determined at each school administratively. If more students are placed into career and technical courses, the school has more opportunity to earn points in that category. If more students are placed into dual enrollment, Advanced Placement, etc. courses, there is a greater likelihood of earning more points for enrollment. The more students are administered the ASVAB (Armed Services Vocational Aptitude Battery) test, the more enlistment points a school can earn.
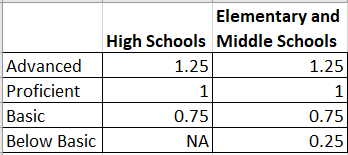
The second advantage enjoyed by high schools is that all SOL tests for high school courses include only three proficiency levels whereas elementary and middle school math and reading SOL tests include four proficiency levels (Table 2). Points are assigned to each proficiency level, and those points are used to calculate the mastery indicator for each school. Since high schools do not include the lowest proficiency level to which only a quarter of a point is awarded, high schools should have higher mastery scores.
The third advantage that high schools have over other schools is that the SPSF calculations for mastery (SOL outcomes) were conducted based on the SOL results of the graduating cohort of students. Mastery scores for elementary and middle schools are based on all students to whom were administered the SOL test that year. For example, the high school mastery scores do not include all SOL tests administered that year, but only for the tests taken over the high school careers of students in the graduating class. Algebra I is typically administered to ninth graders (who didn’t take the test in eighth grade) and is readministered each year until the student passes the test. Only one attempt is counted per student. Elementary and Middle mastery rates are calculated from all tests administered that year, and students don’t have the opportunity to retake SOL tests from a previous grade unless they fail the course.
Other than the high school advantages described above, there are also some edge cases that we have found which cause concern. One such case involves an elementary school which is made up of students from pre-kindergarten through third grade. Since this school does not have sufficient data to calculate the necessary indicators for the SPSF score it is paired with the school that their students attend in grades four through seven. Basically (but not precisely) the data from the two different schools is aggregated for accountability purposes. In this instance, the PreK-third grade school’s students with disabilities scores were higher than over ninety percent of the other schools in our consortium. The students with disabilities scores of the fourth-seventh grade schools were much lower, and caused both schools to be identified for support for students with disabilities. It doesn’t make any sense to identify for support the PreK-third grade school that performed outstandingly with that subgroup, but they are.
Conclusion
The issues discussed above is not an exhaustive list, but is intended to illustrate some factors that should be addressed in future system improvements. This paper should not be construed as an attack on the new SPSF, as there appears to be merit to the system overall. For example, this system certainly differentiates among the performance of schools much more than the old Accreditation system. The problem with continuing to work on this (which should certainly be done) is that the improvement process will extend the time of uncertainty for school and division leaders. Until they know exactly what is expected, they cannot finalize plans to align their efforts accordingly. However, if we end up with a more simple, more transparent, and a more comparable measure across school levels, it will likely be worth the effort.
Matt Hurt is director of the Comprehensive Instructional Program.
Leave a Reply
You must be logged in to post a comment.