Maps of the Day: Revenue Capacity, Revenue Effort


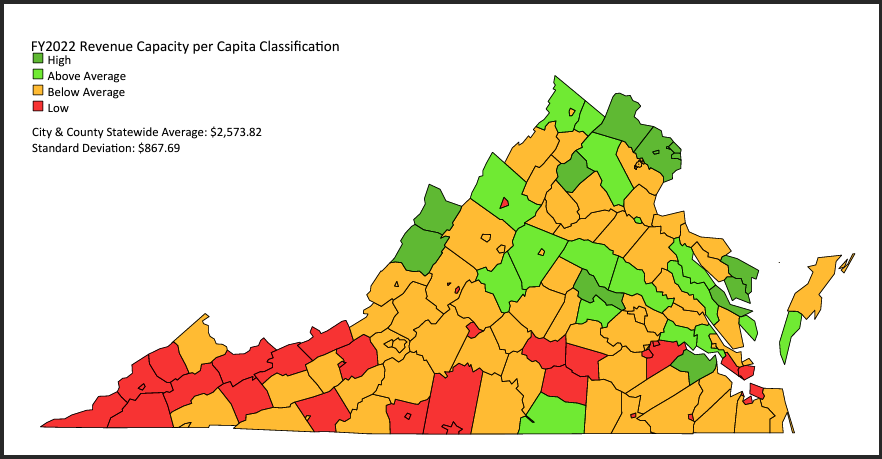
A concept related to “fiscal stress” (see previous post) is “revenue capacity.” The Commonwealth of Virginia defines “revenue capacity” as the amount of revenue a local government would generate if it set its tax rates at statewide averages. The calculation takes into account five main revenue sources: true value of real estate, true value of public service corporation real estate, registered vehicles, local option sales tax receipts, and adjusted gross income. The state Commission on Local Government expresses the resulting number on a per capita basis.

The index compiled by the Commission, based on the most recently available numbers from FY 2022, ranges from a high of $5,886.10 in Bath County and a low of $1,272.16 in Radford City. The average revenue capacity per capita in the Commonwealth is $2,960.72.

The Commission then calculates what it calls “revenue effort” — how much revenue a locality raises expressed as a ratio of its revenue capacity, as seen in the map below:

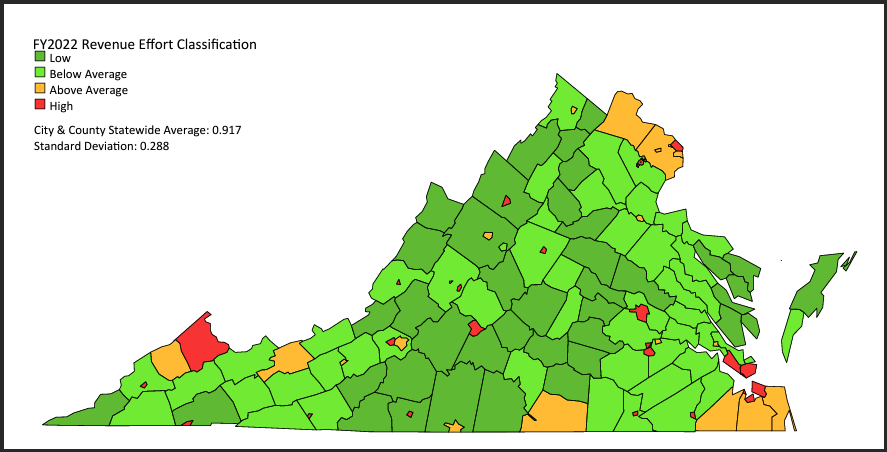
From this map, we can see which localities are willing to tax themselves above and below their means.

Whether expending greater revenue “effort” is a good thing or bad thing will depend largely upon (a) your ideological views toward taxes; and (b) the perceived value of government services delivered.

As a rule, cities have higher taxes than surrounding counties. Historically, the discrepancy arises from Virginia’s local-government structure devised in the 19th century when cities were urban, counties were rural, and the concept of suburbs did not exist. The state constitution empowered cities to raise more taxes in order to provide the higher level of services demanded by urban residents. Since World War II, the rise of the pattern of scattered, lower-density development that we call the suburbs fudged the distinction between urban and rural, and incremental changes to tax laws and public financing have largely erased the differences in revenue sources and taxing powers.

It would be helpful if the Commission on Local Government displayed one more data set: actual taxes collected per capita. The disparity in tax burden between cities and outlying counties is one of the factors, along with schools, crime, walkability and other amenities, that influence where people choose to live and locate their businesses.

— JAB


ADVERTISEMENT

(comments below)


Comments


Comments

11 responses to “Maps of the Day: Revenue Capacity, Revenue Effort”

  1. WayneS Avatar

    The Commission then calculates what it calls โ€œrevenue effortโ€ โ€” how much revenue a locality raises expressed as a ratio of its revenue capacity…

    I think "revenue exploitation" would be a better name for it. Using the word "effort" implies that localities which keep their tax rates below their "revenue capacity" aren't trying hard enough.

  2. WayneS Avatar

    The Commission then calculates what it calls โ€œrevenue effortโ€ โ€” how much revenue a locality raises expressed as a ratio of its revenue capacity…

    I think "revenue exploitation" would be a better name for it. Using the word "effort" implies that localities which keep their tax revenues below their "revenue capacity" aren't trying hard enough.

  3. Eric the half a troll Avatar
    Eric the half a troll

    Again, flow of tax dollars would be an interesting overlay.

    1. DJRippert Avatar
      DJRippert

      Yes, that would be very interesting. You would think that the residents of Northern Virginia would demand to see that calculation.

  4. WayneS Avatar

    It looks like there are about 7 localities which have low "revenue effort", low "fiscal stress", and high "revenue capacity".

    Perhaps other local governments should study how these localities are managed to see if they are doing anything that can be emulated.

  5. f/k/a_tmtfairfax Avatar
    f/k/a_tmtfairfax

    Revenue effort is material because of the school aid formula lacking a mandatory, minimum tax effort. It's only fair for wealthier localities to see more of their state tax dollars help fund schools in poorer districts. But there is a history of many of those lower-income areas cutting real estate tax rates when the state formula sends more money to them. Meanwhile, class size increases in the wealthier areas and real estate taxes increase.

  6. Dick Hall-Sizemore Avatar
    Dick Hall-Sizemore

    The Homestead certainly helps bolster Bath County's revenue capacity, but there is another factor at work. A clue can be found in the rankings of two other rural counties. Surry County is ranked 2 and Louisa, 23. These two latter counties are certainly rural but they lack luxurious resorts and million-dollar homes at the "rivah". But they have one aspect in common with Bath–major Dominion Power facilities–nuclear power plants in Surry and Louisa and a pumped storage station in Bath.

    1. Have you checked the prices of waterfront houses on Lake Anna recently? Many of them are approaching, or even exceeding, $1 million.

  7. Clarity77 Avatar
    Clarity77

    Happy to live in a dark green Low revenue effort county, which just happens to be a conservative bastion. Funny how that correlation happens.

  8. Alternate Opinion Avatar
    Alternate Opinion

    If I may, let me expand upon the disparity in tax burden using a real life example. The reality in Virginia, at least for the smaller rural cities, is that they subsidize the counties and regions which surround them. From higher education, to healthcare, to things like museums, rehab and recovery homes, and other non-profit entities, cities are the preferred location for these entities to set-up shop. These are all tax-free operations when it comes to paying personal property taxes. Personal Property taxes are a cities single largest source of revenue. I live in a smaller city in Virginia. The local hospital is located within City limits. It's a multi-billon dollar operation and pays a few hundred thousand dollars a year in taxes. This is a regional entity that serves a huge regional population base. Ironically, the residents of the city are the minority users of the facility. The surrounding county has 3x as many people using the facility, yet the City absorbs 100% of the tax burden and potential lost revenue if the land was on the tax rolls. Here's the rub – in Virginia there is no way for the City to offset this imbalance in taxation and land use that subsidizes the region that surrounds it. For example, we can't annex land and zone it for a business park to offset what we are forced to give away to the hospital. Nor are the surrounding counties required to kick-in any money to the city for the multi-million dollar give away. If the hospital were a multi-billon dollar operation on the tax rolls the City balance sheet would look much, much different. Citizens of the county and region essentially get a free ride in terms of subsidizing the local healthcare industry.

  9. I live in one of the dark green counties, which means — if I understand correctly — that our county has to capacity to carry a much higher tax burden than we do.

    We are a poor county. Half the kids in our school are on free or reduced lunch. During the COVID lockdown, the school fed whole families with volunteers and school buses delivering two meals daily.

    The reason we are rated as being able to substantially raise our taxes is our waterfront property — Potomac River and Chesapeake Bay. Waterfront property already is taxed at a higher rate than non-waterfront. I live across the road from my waterfront neighbors and my property taxes are ONE-HALF theirs — and my "waterview" property is taxes higher than property in the County interior.

    Our county supervisors admit to keeping the property tax rates low for fear of driving out the retirees and weekend people who own the waterfront and who would revolt at higher taxes.

    Supervisors refuse to enact a business tax for fear of driving out existing businesses (which we don't have) or discouraging new businesses (which we also don't have).

Leave a Reply


ADVERTISEMENT