COVID-19 Update: The Curve Has Flattened

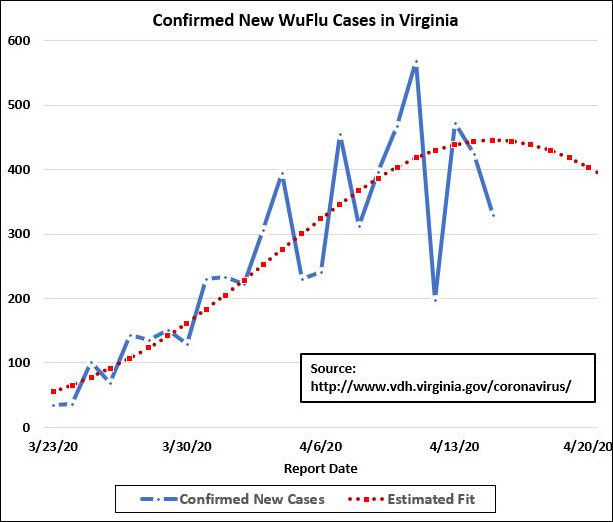
Sure looks to me like the curve is bending in Virginia, just as it appears to be around the world. The latest data from the Virginia Department of Health indicates 329 new confirmed cases of COVID-19 yesterday, less than the number eleven days ago. That’s consistent with what the Johns Hopkins University data is showing for the U.S. as a whole and for many other countries around the world.

The chart above, contributed by John Butcher, suggests that the spread of the virus in Virginia is peaking — assuming, of course, that current social-distancing controls stay in place. If we relax the measures, we can expect the epidemic to regain momentum. But the news is encouraging enough that Virginia public health authorities need to begin thinking about how to dial back social-distancing mandates on the margin in order to ease the devastating toll on the economy and restrictions on individual freedoms.

Here is our daily data summary:

COVID-19 spread

Total tests: 44,168, up 1,406
Total confirmed cases: 6.500, up 329 from the previous day
% tests positive: 23.4% yesterday
Total hospitalizations: 1,048, up 70 from the previous day
Total deaths: 195, up 41
Total hospital discharges: 752, up 31

Hospital capacity

Available beds: 5,617, down 374
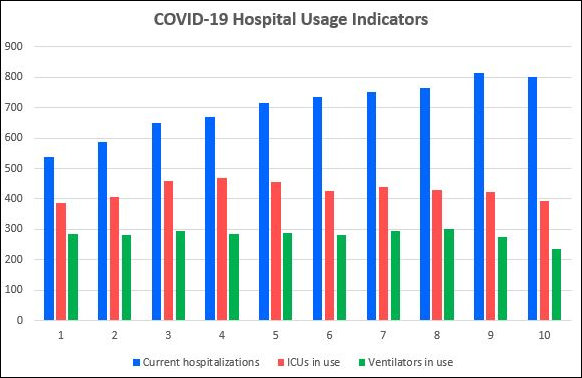
Currently hospitalized for COVID-19:
802, down 11
ICUs in use:
394, down 28
Ventilators in use: 234, down 42

While the incidence of new confirmed COVID-19 cases has flattened, that is only one measure. Because the measure is influenced by the number of tests taken — which, in determined is influenced by the availability of testing kits, it may not be an entirely reliable indicator. But several other indices are consistent with the idea that the epidemic is peaking: new hospitalizations, current COVID-19 patients in hospitals, ICUs in use, and ventilators in use. This data comes from the Virginia Hospital and Healthcare Association:

— JAB


ADVERTISEMENT

(comments below)


Comments


Comments

16 responses to “COVID-19 Update: The Curve Has Flattened”

  1. LarrytheG Avatar
    LarrytheG

    re: ” assuming, of course, that current social-distancing controls stay in place. If we relax the measures, we can expect the epidemic to regain momentum. But the news is encouraging enough that Virginia public health authorities need to begin thinking about how to dial back social-distancing mandates on the margin ”

    what does that mean? Can we articulate right now what that means?

    1. djrippert Avatar
      djrippert

      It means that this is a probabilistic issue. We’ve been totally locked down for quite some time and 41 people died of COVID-19 in Virginia yesterday. While deaths are a lagging indicator they are also both the indicator that is likely most accurate and obviously the most important measure. The IHME model predicts that Virginia’s death rate per day from COVID-19 will peak on April 28 at 33 deaths. That number assumes immediate and completely accurate data gathering. But as we know Virginia’s data gathering is neither immediate nor complete. So, 41 deaths reported on a Tuesday shouldn’t surprise anybody.

      What if the IHME model is basically right? COVID-19 deaths peak on April 28 and then start to decline. Do we relax the lockdown? If so, the IHME model will have to be updated (I think). The model assumes the current level of social distancing, etc. Any relaxation will result in a higher post-peak probability of cases, hospitalizations and deaths. How much higher? That depends on how much relaxation. More relaxation = more cases, more hospitalizations and more deaths SOONER. And that’s the key – SOONER. Flattening the curve only decreased the death toll to the extent it prevented the health care system from becoming overwhelmed and letting some people die who could have been saved if the system were not overwhelmed. Absent a cure, herd immunity, a vaccine or mutation of the virus you have a high likelihood of contracting the virus even under lockdown. It will just take longer to spread. How high a likelihood? Nobody seems to really know. The Germans ran a statistically significant randomized test of a town in a hotspot area and found 15% had the disease. Of course that was a point in time test and there’s no reason to think that the virus has stopped spreading in that town or elsewhere. Original estimates were that 70% of people would eventually contract COVID-19 unless a vaccine was discovered.

      A strict lockdown will slow the spread of the virus but it will get to you eventually. Loosening the lockdown will accelerate the spread over a given period of time.

      So, as Clint Eastwood said, “Are you feeling lucky punk”?

      I’m old enough to be in a high risk group but I don’t have the comorbidities that accelerate risk. And I feel luck enough to eat in a restaurant or drink in a bar. But go to an MLB game? Yeah, I don’t feel that lucky.

      If you don’t feel lucky – stay home. Once there is enough testing the curve can probably be flattened without the blunt force trauma of a mandatory lockdown of everybody. People who came into direct contact with “positives” who have not yet gotten the disease will have to be locked down. Cell phone data can be used to help accomplish this.

      1. LarrytheG Avatar
        LarrytheG

        one of the things most do not know is what is the actual relationship of social distancing to the other metrics like current infected and deaths?

        is this relationship a single number factor or an equation or what?

        is it the same in all the models?

        If we – the folks viewing the model data results don’t know this – how informative is what we are looking at?

        in terms of “feeling lucky”, have you seen the damage done to people who do recover? Many do not get back to normal. It’s not like 30 lashes and you heal up and move on. Some people end up with permanent organ damage.

      2. virginiagal2 Avatar
        virginiagal2

        Actually under lockdown, you are very unlikely to be infected. Proper actions should greatly reduce the total number infected, not just slow it down.

        Iโ€™m not clear on why you all seem to believe that infection is inevitable. You wonโ€™t have a guarantee, but taking action reduces the total number of people infected, not just the rate. The virus does not break down doors or go roaming around at night like Dracula.

        Look at historic epidemics including polio, smallpox, even influenza. You can reduce the number of people who get sick. And with a disease this bad, you really want to do that.

        1. Reed Fawell 3rd Avatar
          Reed Fawell 3rd

          It strikes me this is key question:

          “Iโ€™m not clear on why you all seem to believe that infection is inevitable.”

          I don’t know answer beyond “epidemics like all life ebb and flow.” Perhaps best proof of that is va.gals next suggestion:

          “Look at historic epidemics including polio, smallpox, even influenza” and her conclusion therefrom.

          I recall that others have said “not so fast.” Though not sure why.

  2. T. Boyd Avatar

    I have added VA deaths to the power series and exponential models of the Virginia data. Unlike the USA data, the corner has not been turned. The states that were reporting early in this plague, and dominate the statistics for the US, have definitely slowed, but it is misleading to the public to think that the other states can relax. https://docs.google.com/spreadsheets/d/1PdV_IIPTqPMrUM3XBnCTqpDivj5249X0V_ATX_rpOmE/edit?usp=sharing
    Boyd

  3. Wash DC’s Channel 4’s 11PM news last nite said said no level off yet of cases in DC MD VA. They showed a graph of continued growth of cases in all 3 “states”, but I do not recall the parameter they were plotting.

    Meanwhile DC has revised its peak forecast from end-June to end-May. Not sure why, but obviously there are multiple models and multiple updates of the models as the new data comes it.

    1. LarrytheG Avatar
      LarrytheG

      was the reason for the changed to end of May because the model was updated with the current percent of social distancing?

      what caused that change?

  4. I too would like to be an optimist — but 4 days of data do not a trend make — especially given the reporting problems we’ve been reading about here, the omissions, the erratic, lumpy updates, the inconsistent criteria, and especially given the Easter weekend that’s included in this particular instance.

  5. Dick Hall-Sizemore Avatar
    Dick Hall-Sizemore

    Unfortunately, DOC has reported one offender death due to covid-19.
    The total number of inmates now testing positive has decreased a little–42, with 6 of those in a hospital. The outbreak is still confined to four facilities.

  6. LarrytheG Avatar
    LarrytheG

    I think it’s nothing short of amazing that people held in such conditions are not more widely infected.

    Dick – do you know if they are testing inmates and separating the ones that test positive?

    1. Dick Hall-Sizemore Avatar
      Dick Hall-Sizemore

      They do frequent screening to monitor inmate health. If any inmate has any symptoms, they contact the local health department on advice on testing. For those that test positive, they separate them from the general population. I do not know for sure, but I assume they either test or monitor very closely all offenders living in the pod or housing unit with anyone that tests positive.

  7. Nancy_Naive Avatar
    Nancy_Naive

    Balderdash. Who is fitting that curve? What’s the objective function, e.g. Min sum( (f(n)-data(n))^2). LMSE? Max entropy? what? What is your choice of f and why?

    Unless you can answer those, any results are suspect and is worth no more than a PowerPoint presentation. Given the “WuFlu” labeling, I suspect as much.

    1. djrippert Avatar
      djrippert

      Nobody owes you an answer to any of those questions. If you have a better model – great, use it. If you want to hide under your bed – great, do so. Your comment, as usual, is pointless.

      1. LarrytheG Avatar
        LarrytheG

        She’s making a valid point. If you do not know the basis for the model – what do you actually know other than you “like” that model or not?

        She’s pointing out that models are fairly complicated and they do differ in how they work and yet all most of us really “know” is the graph we’re looking at. Are we really “informed”?

        It’s not about hiding under the bed. It’s about knowing how NOT to.

      2. Nancy_Naive Avatar
        Nancy_Naive

        You’re right. Nobody OWES me anything. Similarly, those who will not, or perhaps cannot, provide their assumptions are owed nothing in return. Well, maybe not nothing, certainly a balderdash.

        As for the Blue Sky proclamation of the all important peak, if we were doing NOTHING to affect the outcome, i.e., including an unmodeled forcing function in the form of “social distancing”, then the peak would be of great value, but in this case, it’s worthless since the effect of removing the mitigating effort would certainly change the trajectory upward again (the assumption of a unimodal function is out the window).

        Peak in that case is unimportant. Better to look for the minimum first derivative in that red curve, or the point where the cumulative number of cases hits what is called “a shoulder”, before even considering letting it run free.

        Also, “confirmed cases” is wide open to error. Look at it. It’s all over the place; nice 2, and 3-delta hop there. It relies on too many events that result in error, not the least of which is the decision to test any given case. Others include the quality and quantity available of the test, the testing agency’s reporting accuracy and timing, and most importantly, the patient even bothering to seek help that results in a test.

        I’d probably look at “confirmed deaths” as a better measure, at least you’re assured of patient cooperation… eventually.

        Oh, and modeling using cumulative will smooth the noise.

Leave a Reply


ADVERTISEMENT