
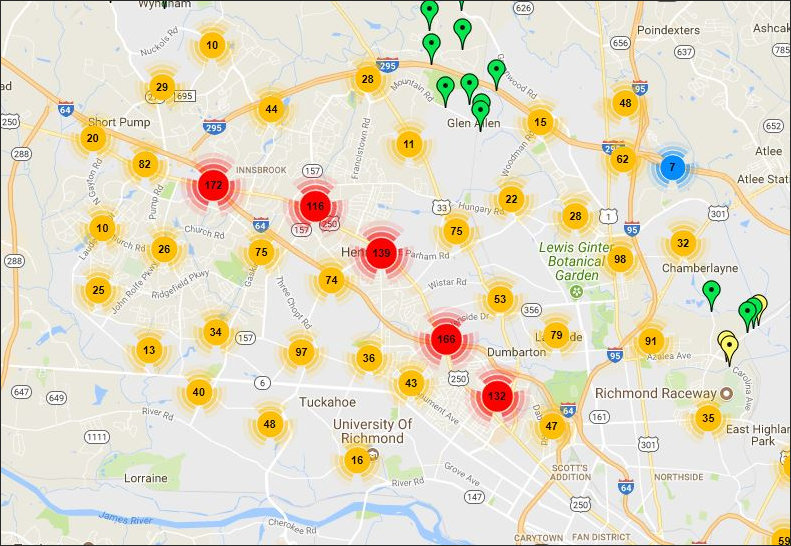
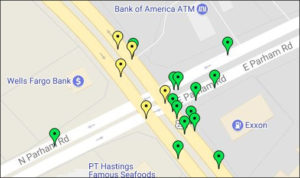
The Department of Motor Vehicles has posted on its website an awesome tool that allows website visitors to explore the geographic location of traffic accidents by individual city and county. You can drop back for a macro overview, as seen in the map of western Henrico shown above, or zoom in to examine precise specific intersections, as seen in the image at left.
Another cool feature is the ability to filter accidents by cause. Was alcohol involved? Were the drivers young (between 15 and 20?) How many accidents could be blamed on cell phones? How many involved deer? Incorporation data going back to 2013, the map can isolate data by single year.
This is a useful tool for citizens who might want to know how accident-prone are the streets and roads near where they live or work, and whether factors such as drinking, teen drivers, or cell-phone distraction were involved. The Crash Locations Map also is potentially useful — though it could be made better, as I’ll explain — for wonks like me who like to examine the relationship between law enforcement, land use and transportation.
On that point, I have long held to a commonly asserted Smart Growth claim that cities are safer than suburbs when it comes to surface transportation. Sure, cities are more densely packed, but city streets are typically less congested than county arterials and feeder streets thanks to the more even distribution of cars across a network of grid streets. That’s the theory.
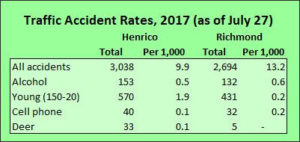
However, the urban City of Richmond has experienced a higher accident rate (as expressed by automobile accidents per 1,000) than its neighbor, suburban Henrico County, so far this year. The accident rate is 13.2 accidents per 1,000 residents in Richmond compared to 9.9 accidents in Henrico.
It’s possible that the rate of the worst accidents — injuries and fatalities, as opposed to fender benders — are higher in Henrico. That’s what one might predict from the deadly-suburbs hypothesis. It stands to reason that higher posted speeds on county roads make accidents more prone to injuries and fatalities.
Alas, while the maps do display accidents resulting in injuries and deaths, the search tool does not allow users to filter specifically for those attributes. So, as a practical matter, it would be exceedingly tedious to see if the data supports the deadly-suburbs hypothesis.
Nevertheless, the DMV deserves kudos for making its accident data more accessible than it was before and for setting a positive example for other state agencies to follow. Maybe one day, the department will add a search feature that allows readers to view the raw data, filter by accident type, and select for multiple localities for side-by-side viewing. One can always hope.
Leave a Reply
You must be logged in to post a comment.