

by Steve Haner
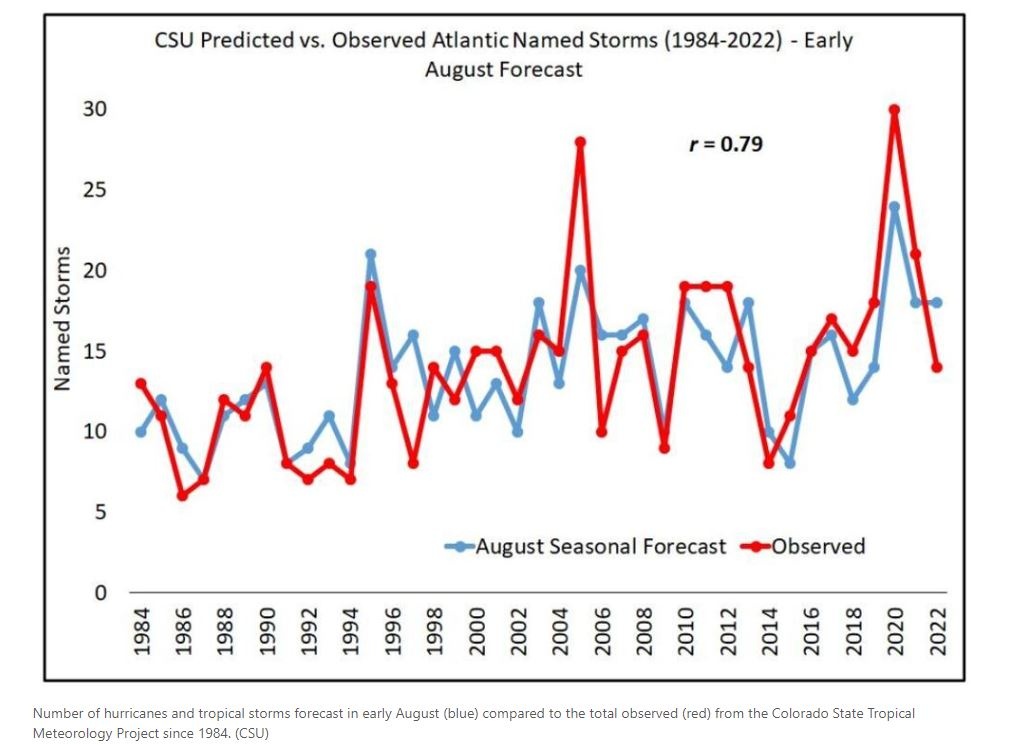
Wednesday’s climate propaganda sermon in the Richmond Times-Dispatch focused on the most recent failure of alarmist media messaging concerning the now-completed Atlantic hurricane season, which turned out to be average. It was predicted to be far more active than average, so once again the prophets of doom were wrong.
Folks in Florida certainly had a bad year, with two of the eight U.S. hurricanes hitting vulnerable and heavily populated beaches and barrier islands. But in the Atlantic region overall, looking at decades of records, it was a typical year. There is no sign in long-range data of any increase in storm activity or intensity over time.
Predicting increased extreme weather is now the go-to move for the alarmist media. Just about every local or wire story about flood or drought or fire, extended hot days or record snows, includes a claim that climate change will bring more extreme weather. In every case, the long-term trends do not agree. Sometimes the trend lines are down, as is the case with wildfires.
You will never read that admission about wildfires. The fact that the Times-Dispatch revisited and sought to explain away the failed hurricane prediction displayed more honesty than is usual in the media. But, then, it used an illustration that shamelessly started the storm count in the 1980s, intending to mislead readers by ignoring the whole data set you see above.
There is no climate crisis. There is very little climate change. The data are why I reject the need for a crash program to reduce CO2, such as Virginia’s ongoing rush toward energy poverty.
There was an earlier discussion here in February, when an advocacy group called the CO2 Coalition compiled a Virginia-specific data set challenging climate change and climate catastrophe claims. The data are solid, so expect instead personal attacks on the credentials of the scientists or claims the group is just a fossil fuel industry front.
The data show that Virginia’s recorded surface temperatures have risen only very slowly, with much of the rise a reflection of rising nighttime lows, not daytime highs. The actual change trails the models. A few months ago, in an email exchange, one of the contributors to that report went into a bit more depth with me.
The following is from John Christy, a professor at the University of Alabama Huntsville, director of its Earth Systems Science Center, and Alabama’s State Climatologist:
The (National Oceanic and Atmospheric Administration) June-August daytime temperature for Virginia has a trend for 1895 to 2022 of +0.6 °F per century, i.e. almost zero. The nighttime summer temperatures are rising twice as fast (+1.1 F/century), but still nothing to write home about.
But the big story is if you cherry-pick the starting date to be 1960. From that point nighttime summer temps are rising at a rate of +5.7 F/century and summer daytime at +2.9 F/century. But that’s a trick that “disappears” the hot years prior to 1960.
In fact, if I start at 1930, the daytime summer temps have a trend of +0.1 F/century (which is the same as zero). Starting in 1930, the summer nighttime temps have risen at a rate of 2.0 F/century, so you can see that this differential warming is a consequence of development around the station sites and not greenhouse gases.
Christy has published research to back up his argument that most of the nighttime temperature rise is due to heat-retaining structures influencing many of the measurement locations. Indeed, the so-called heat island effect is widely accepted, even popular with climate alarmists who point to disparate impacts of rising temperatures on urban residents. See this from the Times-Dispatch.
But the vast atmosphere above the immediate surface of the planet is the same rural and urban, and constantly in motion. The climate models so crucial to all the dire prophecies all predict comparable temperature rises day and night, which isn’t what happens. The night versus day disparity and similar urban versus rural disparities in temperature change point to development patterns and not CO2 or methane as the cause, or certainly a major factor.
University of Alabama Huntsville also processes and tracks the satellite data on global temperatures by month, data which currently show an 8-year pause in atmospheric temperature increases. It could start to rise again It could also reverse and start to drop. Trust neither prediction.
Heat waves? Christy was also the source of this illustration (below) in the CO2 Coalition Virginia report. It tracks 7-day heat waves in Virginia, the Southeast U.S. and the whole U.S. The wave of heat waves peaks in the 1930s, drops dramatically for several decades, and then is back up a bit in Virginia in the last two decades. But the peak in the 1930s and then drop through the 1900s are totally inconsistent with the narrative about post World War II emissions growth.

Tornados? This week’s late November outbreak was touted as proof of climate change on Wednesday’s NBC Nightly News. But a quick check finds that similar November outbreaks go back for years, and in a 2013 report on that year’s November flurry NOAA data showed a November average of 58 tornados.
Rainfall? Here is another chart from the CO2 Coalition report. The effect of poor rainfall that matters most is drought, and over the 130 years mapped below the up and down pattern has gyrated within narrow parameters here in Virginia. The major drought outlier happened in the 1930s, same as the heat waves.

Relative sea level rise? That one has been addressed often here on Bacon’s Rebellion (also here and here.) The most accurate tidal gauges show slow and steady change that contradicts the claims of acceleration of land loss. It predates modern CO2 emissions. In Virginia, land subsidence is the real issue. Improved storm water management and coastal protections are imperative, but unrelated to CO2 from natural gas or gasoline. It is, however, one data set showing a discernable and steady pattern, so the alarmists love it.
Sea ice? It is building nicely already in the Arctic, which might be a harbinger of more polar express weeks this coming winter. We are now up to forty years of failed climate catastrophe warnings, yet a huge portion of the world’s population simply accepts the one-sided reporting and stands ready to pay immensely more for unreliable wind and solar electricity.
This column won’t change minds set in concrete. The debate this might spark in the comment columns below will illuminate nothing. The true believers run to the false claim of “settled science,” ignoring data. The political and financial benefits of terrifying the population into accepting a radical shift to a dangerous energy policy are just too rich to abandon.
Leave a Reply
You must be logged in to post a comment.