

by James A. Bacon
CollegeBoard has released SAT data for the 2021 testing season, and the good news for the Old Dominion is that Virginia high school graduates outperformed their peers in the other 49 states (and Washington, D.C.). Virginia’s average overall score of 1151 for English and Math was 91 points higher than the national average.
Even in a normal year, however, comparing state SAT scores is a dicey proposition. This year, after K-12 schools across the country adopted widely different strategies in response to the COVID-19 epidemic, comparisons are even more problematic.
“While this year’s results represent a snapshot of achievement on the SAT during an extraordinary year,” said Superintendent of Public Instruction James Lane in a press release yesterday, “Virginia students overall continue to perform well above their peers nationwide.”
Lane’s statement holds up under scrutiny, as I shall show momentarily. Virginia’s schools did outperform their peers. However, Virginia schools have always outperformed other states. The key question for Virginia voters evaluating the performance of the Northam administration is whether Virginia’s lead over other states grew or shrank in the past year. Did we fare better or worse relatively speaking? Answers are difficult to come by.
For now, let’s limit ourselves to examining the claim that Virginia outperformed its peers.
One thing that makes comparisons difficult is that states have widely varying racial/ethnic mixes. For a variety of historical — and some might say cultural — factors, Asian Americans consistently achieve the highest scores on average, followed by Whites, and then Hispanics, with Blacks at the bottom. All other things being equal, one would expect a state with high percentages of Asians and Whites to outperform states with high percentages of Hispanics and Blacks on average.
As seen in the graph atop this page, taken from the VDOE press release, Virginia’s Asians scored higher on English and Math tests on average than Asians nationally, Whites outscored their White peers, Hispanics their Hispanic peers, and Blacks their Black peers.
That seems to suggest that Virginia schools are doing something right.
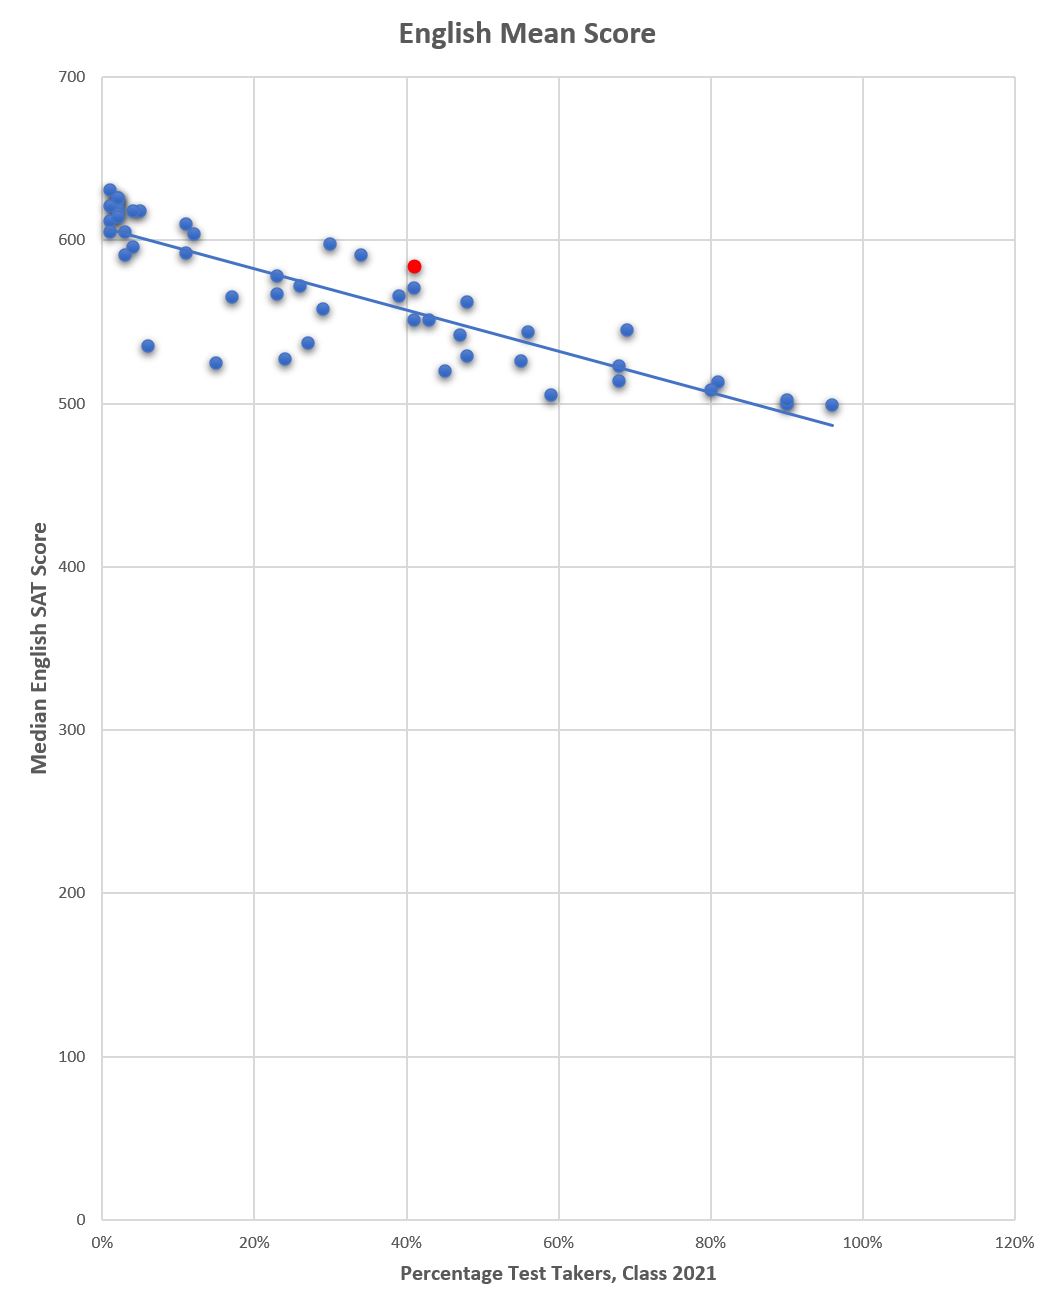
Confounding such a conclusion, however, is the wide variation in the percentage of each state’s student bodies taking the SAT exams. In numerous states only 1% of the 2021 graduating class took the exams. At the other extreme, 96% of Delaware’s students sat for the tests. There is a fairly tight correlation between average SAT scores and the percentage of students who take it. As a rule, students intent upon going to college — who tend to be more academically gifted — are far more likely than others to take the SATs than low achievers. States with small percentages of test takers are testing their best and brightest, while states with high participation percentages are testing the academically strong and the weak alike.
Virginia stands in the middle of the pack with 41% of its students taking the test. Nineteen states tested higher percentages; two had about the same percentage.
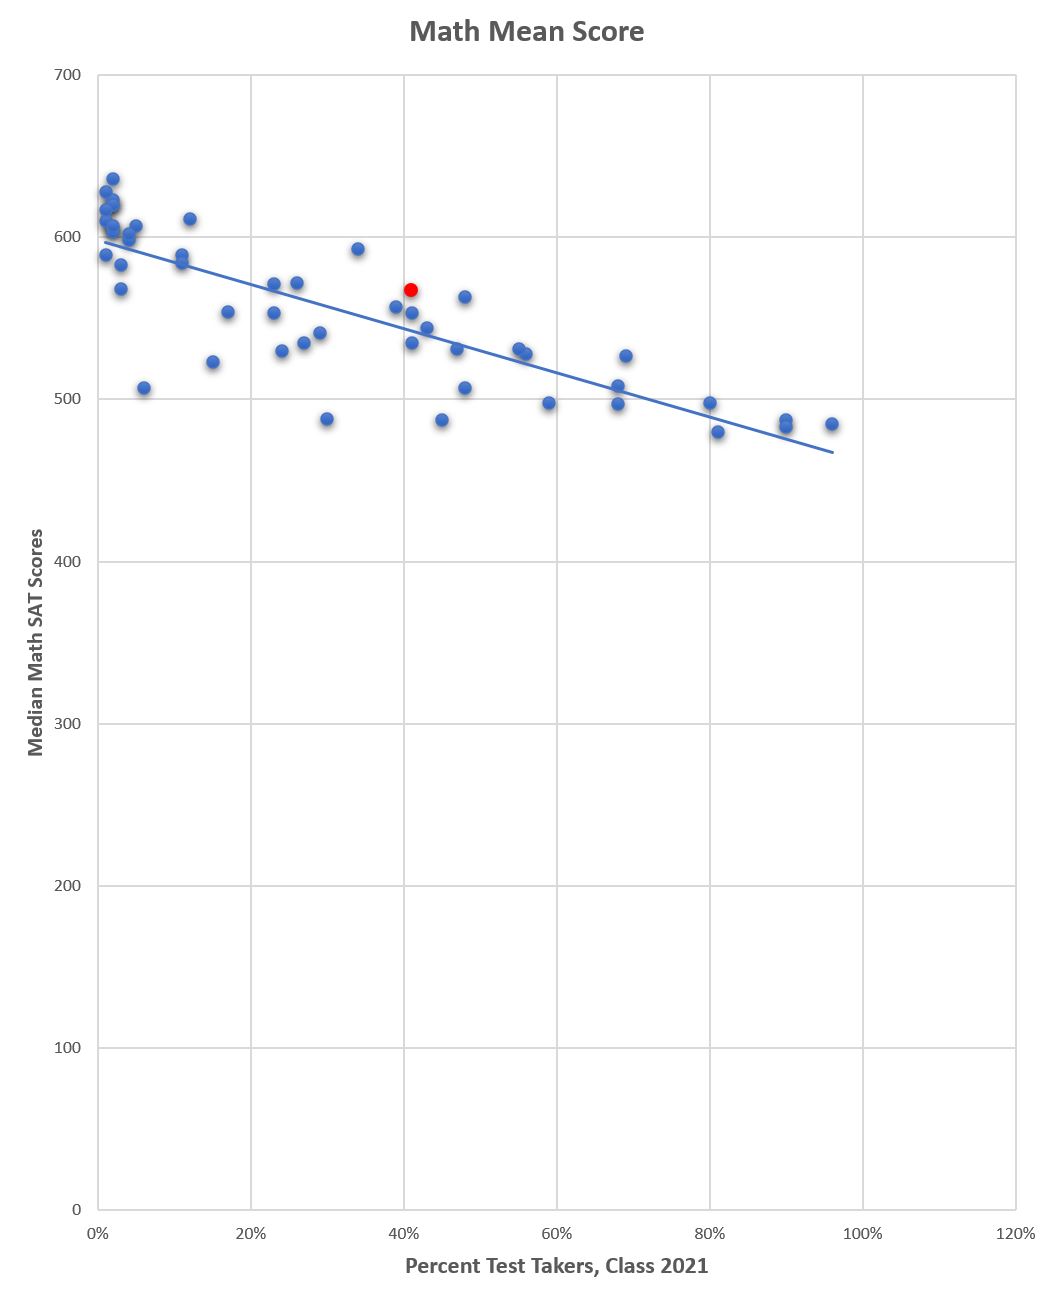
I compiled the following scatter graphs showing the correlation between the percentage of test takers and the average SAT scores for each state. The red dot is Virginia. In the graphs for both English and Math, Virginia is located above the trend line, suggesting a modestly superior performance in both areas.
None of this comes as a surprise. Students’ educational achievement is significantly correlated with the education levels of their parents, and Virginia has one one of the most highly educated populations of any state in the country (with big disparities, however, between Northern Virginia and downstate). By themselves, average SAT scores don’t tell us much about the educational value added of the school system.
I am concerned that the adoption of “social justice” criteria is harming the quality of education in Virginia. An erosion of comparative standing might suggest that something is amiss. But comparing students’ academic achievement in 2021 with achievements in 2020 and in earlier years is fraught with difficulties when the percentage of test takers varies year to year. Making the challenge even more difficult is the fact that other states are adopting “social justice” methods as well. If there is a “race to the bottom” for academic standards, it might be difficult to spot in the relative SAT scores.
I’ll try to crack that nut. The job may exceed my analytical capabilities. If I come up with some meaningful numbers, I will report back to readers. For now, we’ll have to settle for the conclusion that Virginia’s high school seniors modestly outperform their peers nationally.
Leave a Reply
You must be logged in to post a comment.