
by John Butcher
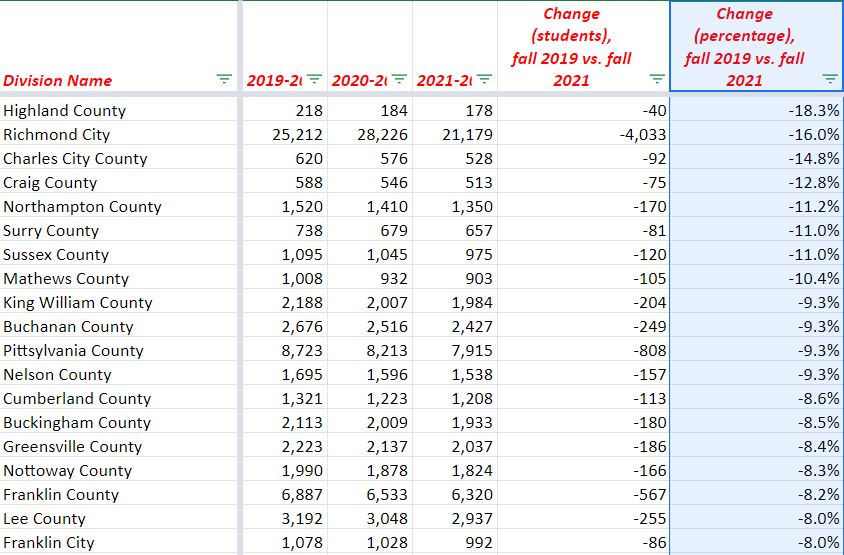
The estimable Jim Bacon recently posted on declining enrollments in many public schools. He used VDOE data comparing the fall division enrollments (aka division “memberships”) in 2021 with those in 2019. Those data showed the largest drops in “rural, non-metropolitan” areas.
Of course, most Virginia school divisions are in such areas.
Highland County, with the smallest enrollment in Virginia, provides an extreme example. Here are its enrollments, back to the fall of 2011, compared to the state totals. Enrollments are presented as percentages of 2019 in order to fit the disparate enrollments onto the same graph.
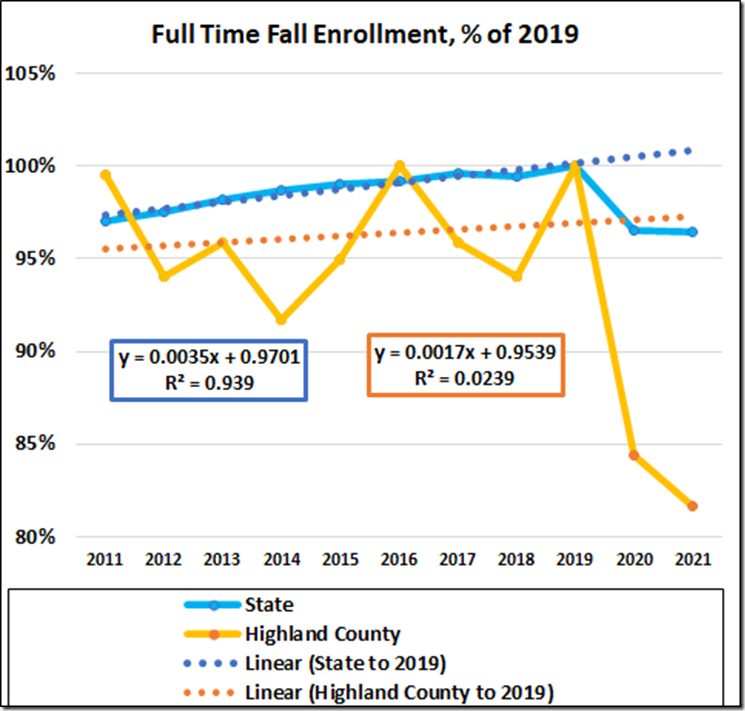
Notes: The spreadsheet Jim relied upon reports the data by school year, e.g., 2019-2020. These being fall enrollments, I just use the fall dates, e.g., 2019. The (least squares) fitted lines in the graphs here use the data from 2011 through 2019 and are extrapolated to 2021.
The state data showed a 3.6% decrease from 2019 to 2021. Before 2020 the state enrollment showed a consistent increase; if we extrapolate that trend to 2021, the difference between the extrapolated value and the 2021 number is –4.4% relative to the extrapolated number.
The scatter in the Highland data is to be expected, of course; such small enrollments (178 in 2021) will vary from year to year. The 2021 number is –18.3% v. 2019 and –16.0% v. the extrapolated value.
The R-squared value on the Highland County pre-2020 data, 2.4%, tells us to disregard any correlation. Even so, the pattern of the 2021 and 2022 numbers suggests a persistent decrease, but don’t bet any real money on how large it might actually be.
The comparison of 2021 numbers to the extrapolated enrollments jumps Richmond to the top of the list (17.6% decrease), thanks to its increasing enrollments pre-2020.
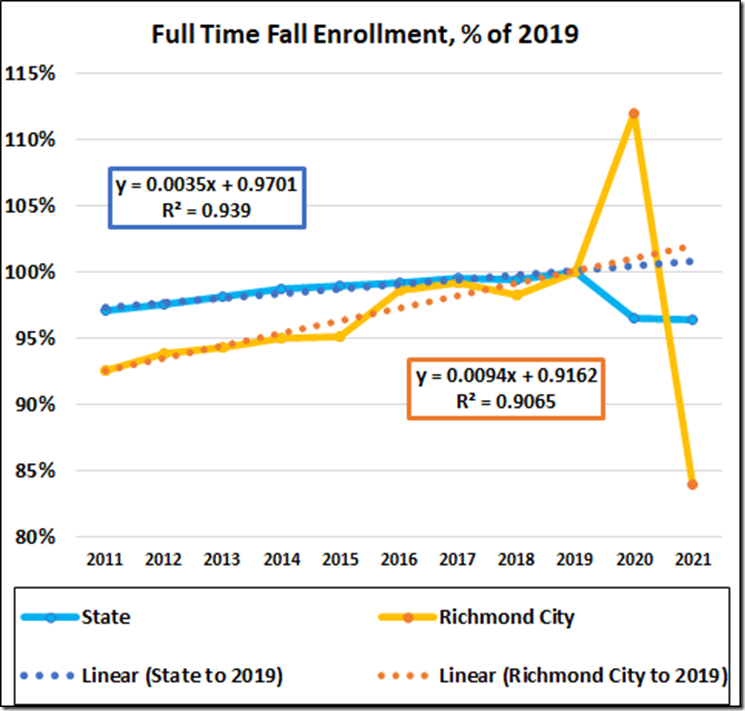
The 2020 datum, however, suggests something unusual is going on in Richmond. The modest scatter before ‘20 lends some credence to the extrapolation but the huge difference between the ‘20 and ‘21 data counsels caution about any conclusions as to 2021.
With a dose of skepticism, then, here are the nineteen largest decreases from the expected (extrapolated) numbers:
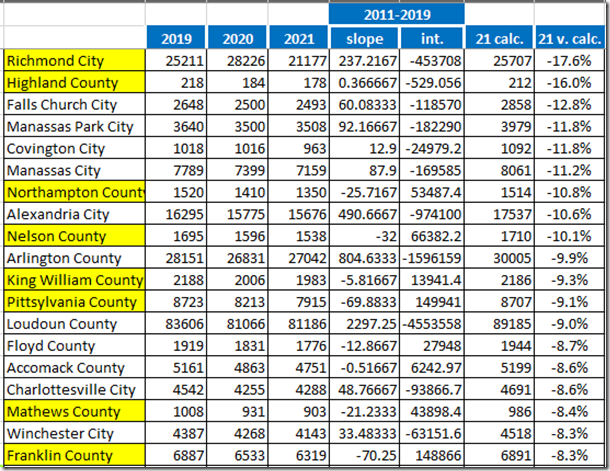
The highlighted divisions are on Jim’s list of the 19 biggest losers.
Notice that the preponderance of “rural, non-metropolitan” divisions has disappeared. Indeed, Alexandria, Arlington, and Loudoun have joined the list, along with Falls Church, Manassas, and Manassas Park (and Fairfax is just four below Franklin County). Charles City, Craig, Surry, Sussex, Buchanan, Cumberland, Buckingham, Greensville, Nottoway, Lee, and Franklin City from Jim’s list are absent here.
Alexandria’s state-sized enrollment decrease after 2019 is much more interesting in the context of the consistently rapid increases before 2020.
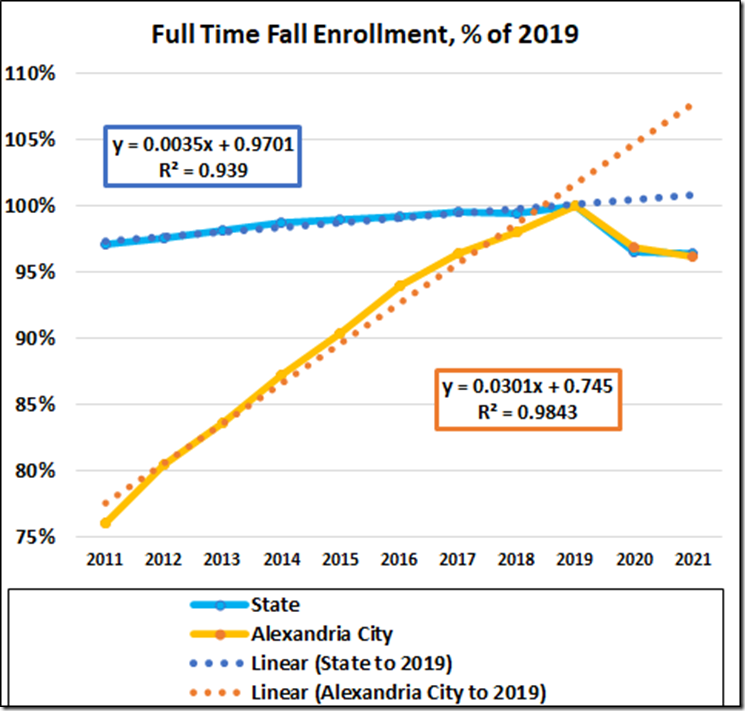
The decrease from 2019 to 2021 is 3.8% but the decrease from the extrapolated value is a much more dramatic 9.9%
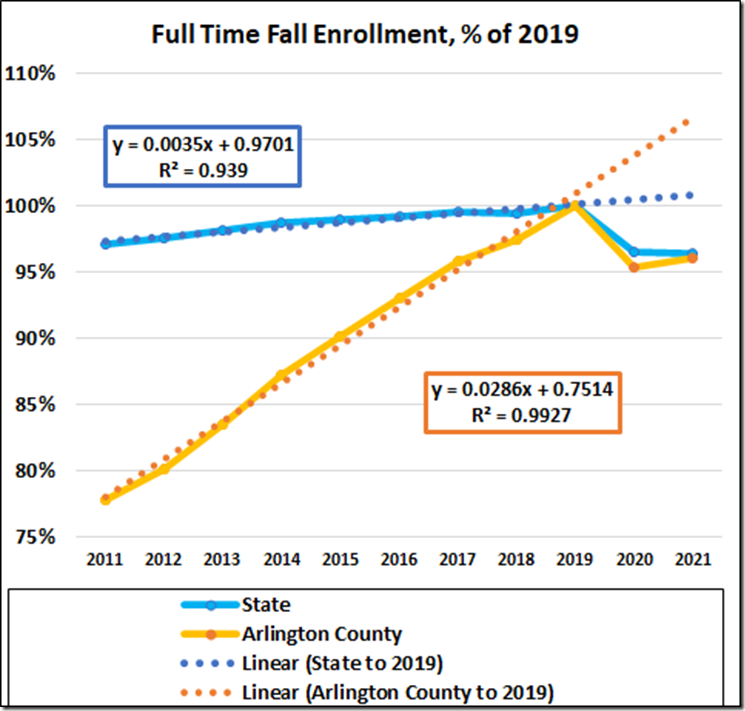
Arlington shows a similar pattern.
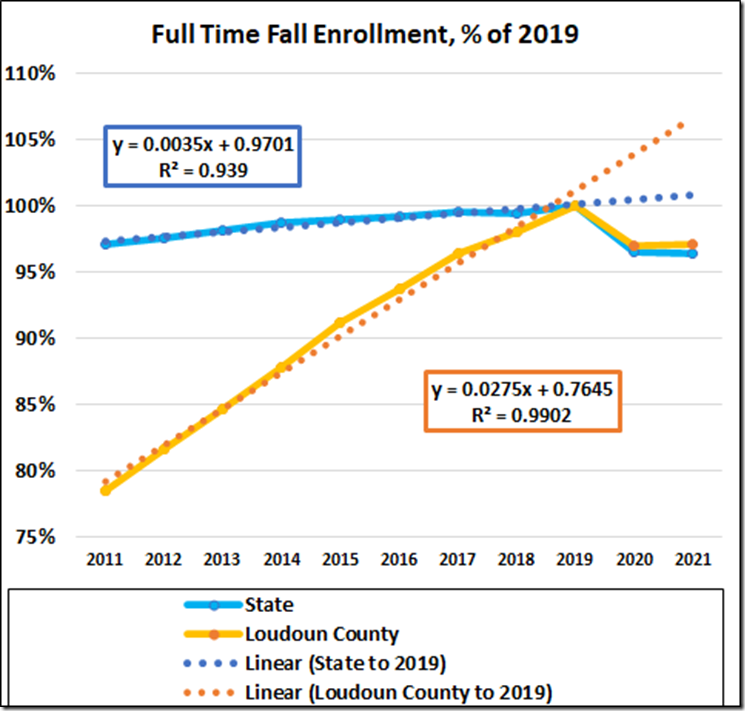
As does Loudoun.
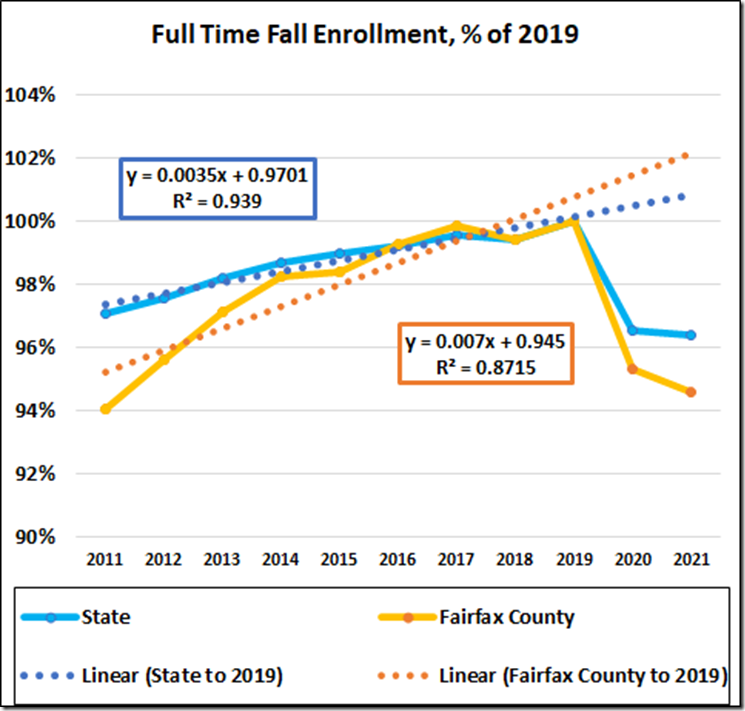
Although just off the list, our largest division, Fairfax, also a part of the NoVa complex, shows a milder version of the same pattern.
Alexandria, Arlington, Loudoun, and Fairfax enrolled 24% of the state total in 2021. All four closely mirrored the state decreases in ‘20 and ‘21; all their decreases were much larger, however, in light of their pre-2020 increases.
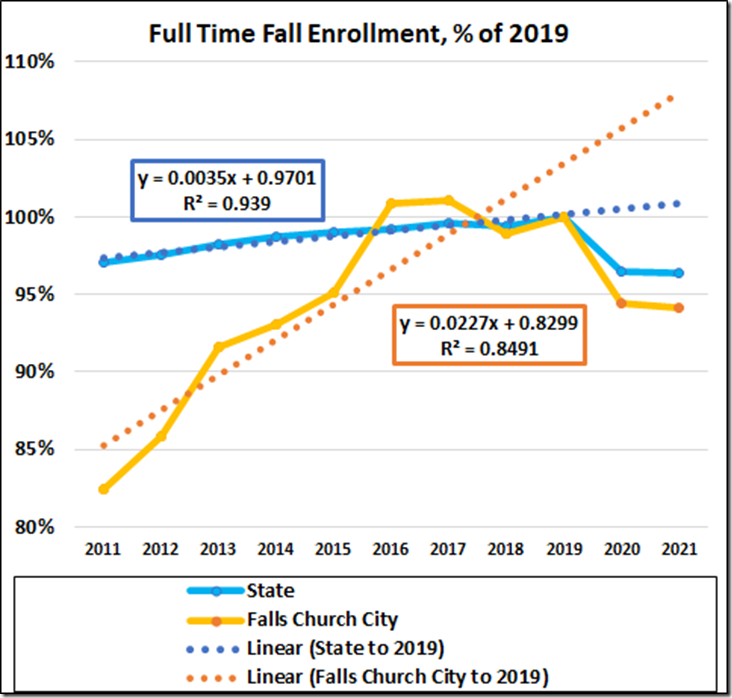
BTW, Falls Church, although much smaller, shows a similar pattern.
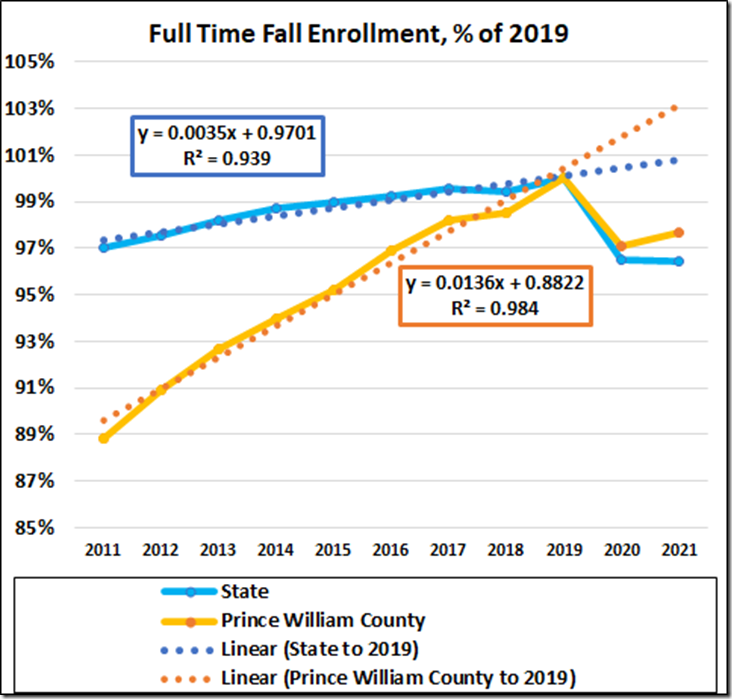
And Prince William, with a 5.3% decrease, shares the pattern.
Clearly, something changed in those suburban DC divisions, reversing histories of increases. The similar patterns suggest similar forces working to increase and then reduce the enrollments. The increases were probably driven by population growth. These data do not confirm that, of course. To the point here, they do not tell us what might have caused the more recent decreases.
Turning to the other end of the list, here are the big gainers from Jim’s post.
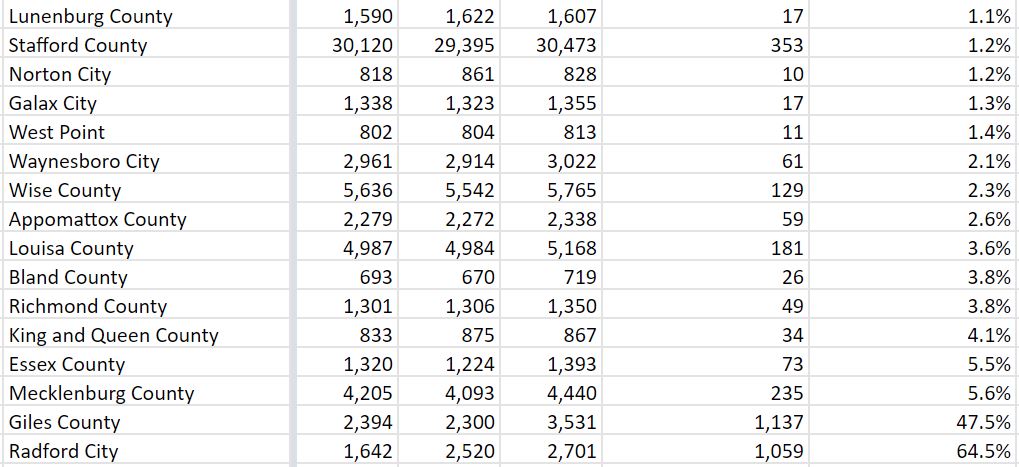
As Jim noted, these are mostly “rural, non-metropolitan” areas.
And here are the extrapolated top sixteen.
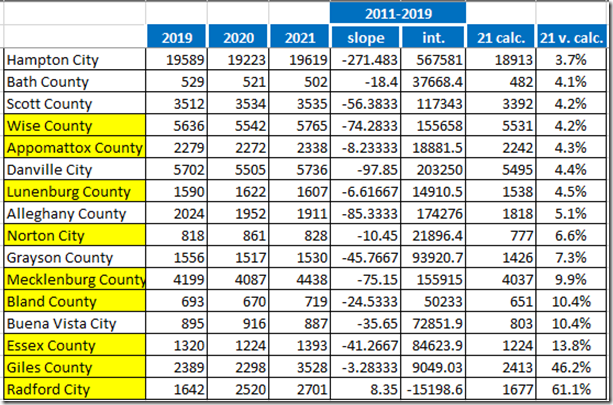
The highlighted divisions are in Jim’s top-sixteen. Except for Hampton, the divisions here also are, again, mostly “rural, non-metropolitan” areas.
Radford has seen a huge relative increase since 2019.
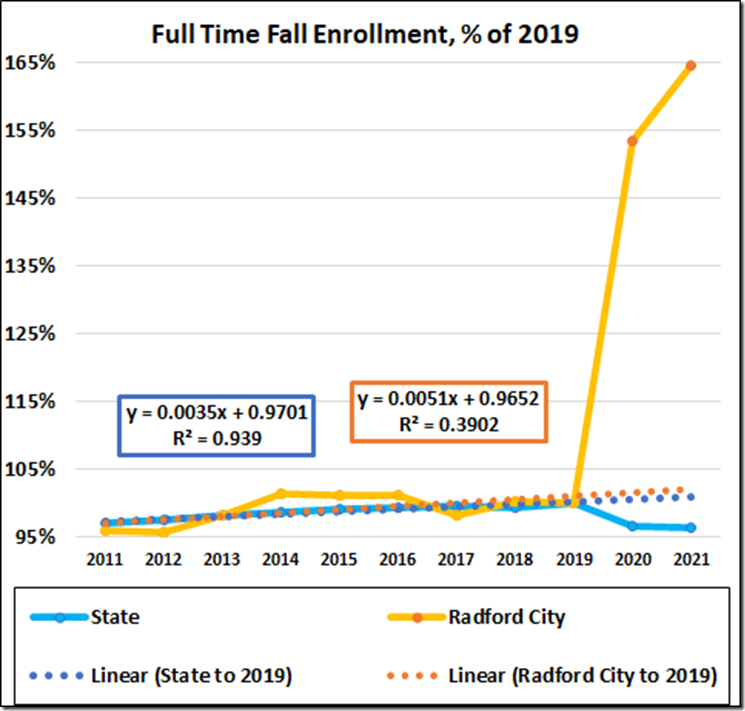
The actual numbers are 2019 membership of 1,642 vs. 2,701 in 2021. Small numbers, large relative change.
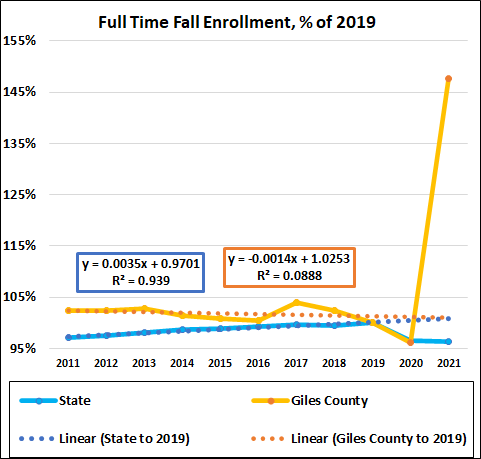
Giles is similar.
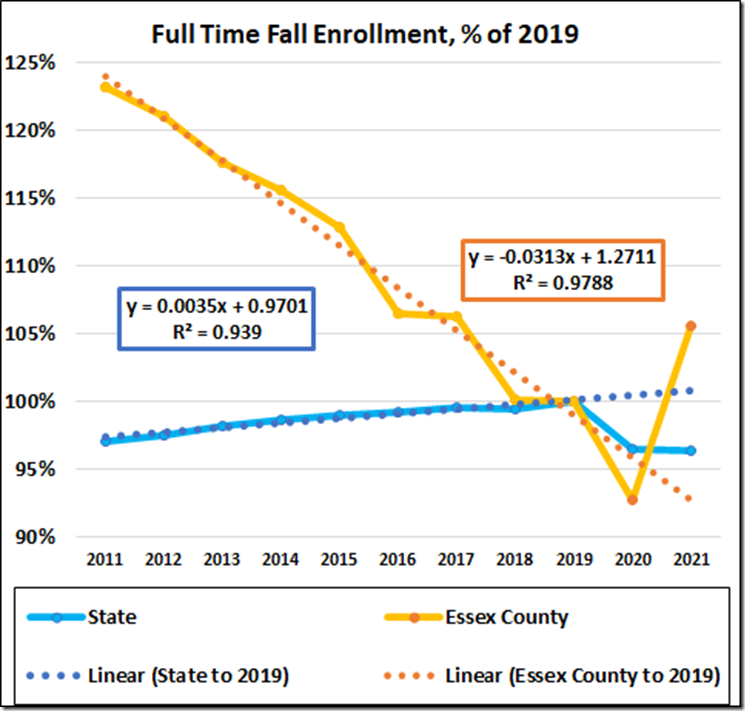
Essex reversed a declining enrollment.
The larger, urban division in this list is Hampton (nearly 20,000 students), where the 2021 increase runs counter to a pattern of decreases.
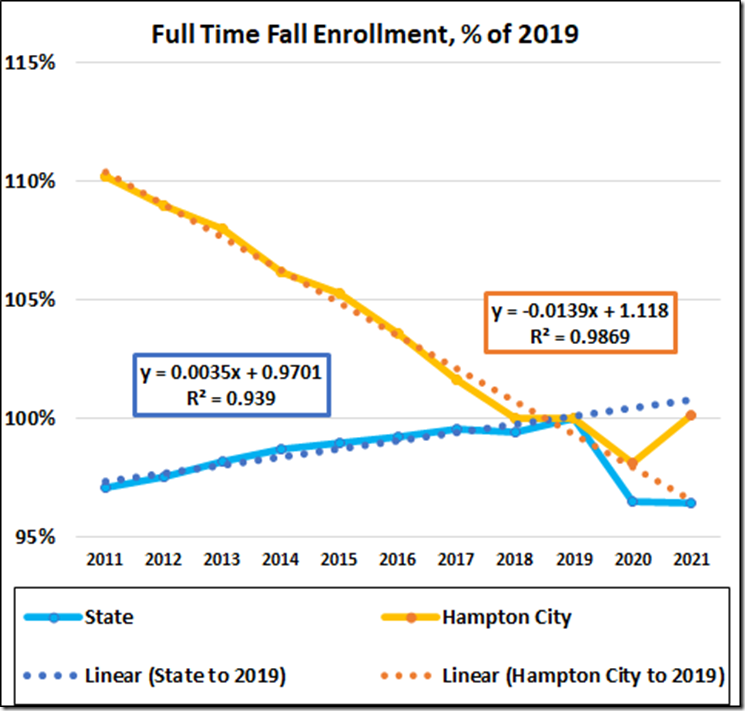
None of these patterns looks like those of the NoVa divisions.
One possible factor in the many enrollment decreases is an increase in home schooling and exercises of the religious exemption. Matt Hurt has posted data showing increases of home schooling and/or religious exemption counts from 2020 to 2021. Most of those were in the lower grades.
The VDOE data show a state-average 40% increase in the Home+Religious total from 2019 to 2021. Comparing the division totals with the calculated 2021 enrollments gives a measure of the potential H+R effect on the calculated enrollment change.
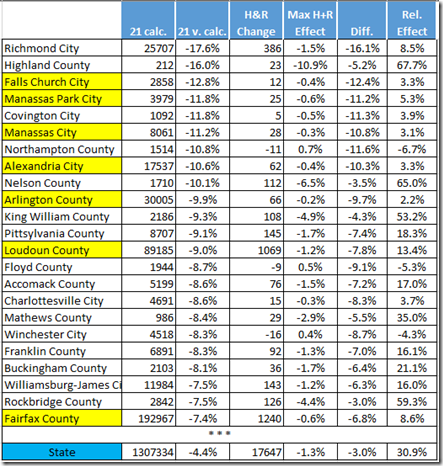
Statewide, the H+R change was 30.9% of the enrollment change. In Highland, the H+R change was 67.7%. In the NoVa jurisdictions, the change ranged from 13.4% in Loudoun to 2.2% in Arlington. Prince William was –24.2%. We can infer that increases in home schooling and religious exceptions were major factors in some enrollment decreases, but, with the possible exception of Prince William, not in those large decreases in NoVa.
We don’t have data to tease out the effects of increases in private schooling, departures from the jurisdiction or other potential causes of the post-2019 enrollment decreases.

