Most Virginia news media duly reported the release of the latest Standards of Learning (SOL) data showing the biggest collapse in pass rates in the history of the SOLs. Most accepted the Northam administration’s spin that the decline was due mainly to COVID-19-related disruptions, and that Virginians should not read too much into the results. Then the media dropped the story. K-12 news coverage moved on to other topics such as the shortage of teachers and bus drivers. (The Washington Post did not deem the SOL story worthy of coverage of any kind.)
You’d think that a collapse of the magnitude seen in the 2020-21 school year — 46% of all students failed to pass their math SOLs — would generate greater interest. You’d think widening racial gap in educational achievement — 66% of Black students failed their math exams — would prompt more scrutiny. Perhaps if the governor were a Republican, the media would be more interested in exploring the story.
Whatever the reasons for the media’s lack of interest in the most important K-12 education story of the year, Bacon’s Rebellion is prepared to step in.
Every school district faced the COVID-19 pandemic. Every school district had to make tough choices based on imperfect and evolving information about whether to continue in-person classes, shift to remote learning, or cobble together a hybrid of the two. But in some districts, the decline in SOL performance was far worse than in others.
The Virginia Department of Education (VDOE) cautions against reading too much into the data. After all, between 20% and 25% of students did not take the SOL exams this year. Comparing 2020-21 results to results from 2018-19 (students did not take the exams in 2019-20) would be comparing apples to oranges. But that’s a bogus argument. As I’ve shown in a previous post, SOL pass rates are highly correlated with socioeconomic status and disability status. If there had been a pronounced change in the ratio of economically disadvantaged or disabled students taking the exam, one could legitimately conclude that the results were skewed. But economically disadvantaged and disabled students were no more or less likely to take the SOLs than their peers. VDOE has offered zero evidence to suggest otherwise.
The past year was an unprecedented educational calamity, especially for African-American students. Only 34% of African-American students across the state passed the math SOL — half the percentage of two years previously.
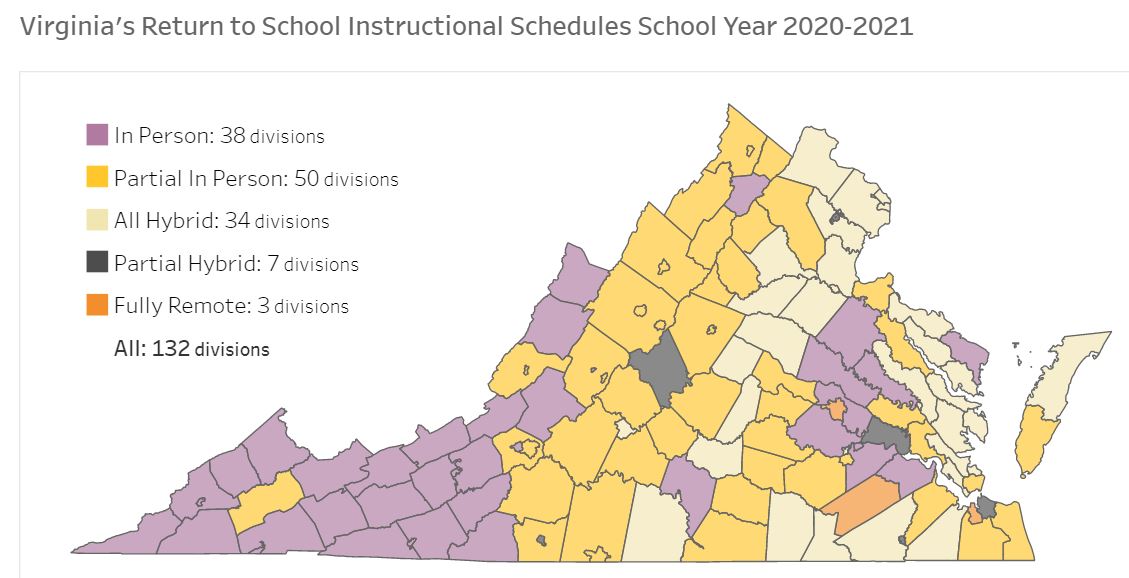
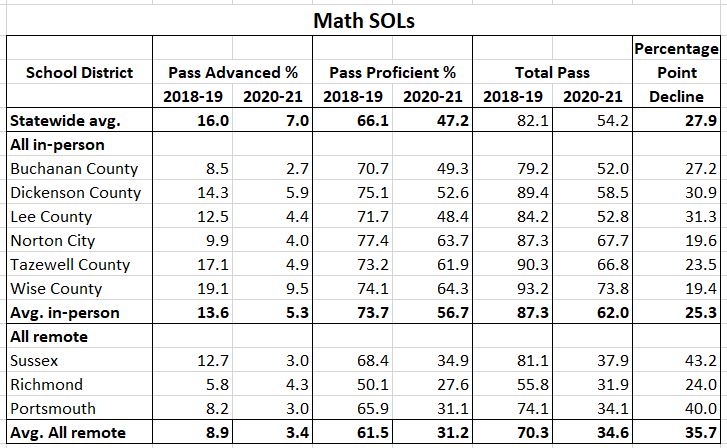
As a preliminary exercise in analyzing the impact of the COVID shutdown, I compared six of the 38 school districts that were reported to have been conducting in-person learning as of March 22 to the three school districts that were reported to be operating fully remote.
I selected six coalfield counties in far Southwest Virginia as the basis for comparison because all six are fiscally challenged and serve large populations of economically disadvantaged students, similar to the three districts that had all-remote learning.
As shown in the far-right column, the in-person school districts saw a 25.3 percentage-point decline in the total pass rate. Clearly, holding in-person classes did not insulate these districts from COVID-related disruption. Pass rates declined markedly, even though students were attending in person.
But the in-person schools out-performed the state average decline of 27.9 percentage points, which in turn out-performed the 35.7 percentage-point decline for the all-remote schools. Clearly, in-person learning helped to mitigate the impact of COVID.
Most noteworthy was the collapse in pass rates in Sussex County, which had put in a respectable performance in 2018-19. The math pass rate fell from 81.1% to 37.9%. For Black Sussex County students, the pass rate fell to 29.9%. For disadvantaged Black Sussex County students, the math pass rate fell to 22.3%. Not one disadvantaged Black students in Sussex County achieved an “advanced” pass rate. Will these students ever catch up, or are they doomed to be semi-numerant all their lives?
To be sure, this analysis is highly preliminary. For starters, it would be useful to aggregate the data for all 38 in-school districts, not just the six I looked at. It would also be useful to compare the various classifications of hybrid school districts, as seen in the VDOE map below.

Further, it would be helpful to take into account the fact that some school districts shifted from one classification to the other during the school year, and that various other policies — mask wearing, social distancing, student access to the Internet, and more — might have had an influence.
I don’t have the capacity to crunch all those numbers. VDOE does. The data exists to estimate the impact of different COVID policies on SOL performance. VDOE does not appear to have any interest in making such an analysis. It wants to set the 2020-21 year as a new baseline for performance for the years ahead, which would let it off the hook, and forget how we got there.
Parents and taxpayers should demand an accounting.


