
by James A. Bacon
The pace of new housing construction in Virginia has fallen markedly since 2000 compared to the three previous decades, according to the Virginia Association of Realtors.
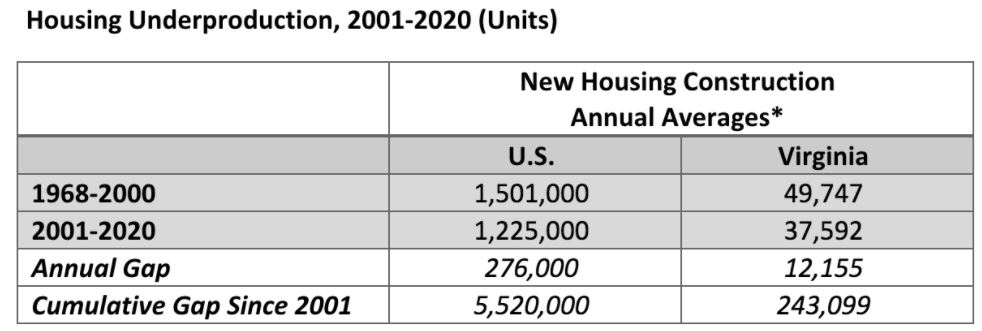
Between 1968 and 2000, 49,700 permits on average were issued annually for the construction of new housing units in Virginia. Since then, permits issued have averaged 37,600 new units yearly. Over the past two decades, the “housing gap” amounted to 243,000 units, writes Lisa Sturtevant, chief economist for Virginia REALTORS, in the association’s blog.
The deficit in housing construction drives up rents and home prices, Sturtevant says. “The consequences of the housing shortfall go beyond economic. Insufficient housing production has led to lower rates of household formation, more young adults living at home with their parents, and significant deterioration of the housing stock in many parts of the country.”
The numbers are valuable but the analysis is incomplete. What if the slowdown in housing construction simply reflects a slowdown in population growth and household formation? Surging housing prices and homelessness suggest that shortages are in fact occurring, but we need to compare the number of housing permits issued with the growth in population and households to know for sure.
Here are some preliminary figures, which I’m sure Sturtevant could refine.
Between 2000 and 2019 (based on her numbers), housing permits were issued for roughly 714,000 housing units.
Between 2000 and 2019, according to Census Bureau numbers, the number of housing units in Virginia increased by 658,000, bringing the total number of housing units to just shy of 3,600,000.
Why the difference between housing permits and the actual housing count? One possibility is that not all housing permits resulted in new houses. Another factor: presumably some housing units were torn down during that period.
More importantly, did housing construction keep pace with population growth? The number of households over the same period, according to Census data, increased by 452,000. In other words, Virginia housing markets saw the housing supply increase by 200,000 more than the number of households. That looks more like a surplus than a shortage!
The story gets more complicated the deeper we dig. The number of occupied units is less than the number of total units. Why? Because some units are vacant. In 2000, the number of vacant units amounted to 205,000. I could not readily identify the number of unoccupied units in 2019 (or 2020, for that matter). However, these numbers imply that even if the number of vacant units had doubled over that period, housing supply and demand would have stayed in balance. Is a doubling of vacant houses in Virginia plausible given the urban revitalization and gentrification we’ve seen over the past decade?
Perhaps so. Perhaps the vacancies are occurring in rural areas that are losing population. Yet another possibility: Perhaps the number of weekend/vacation homes, which are vacant most of the time, has increased dramatically.
Crunching statewide numbers gets us only so far. Statewide averages obscure important regional dynamics. A supply-and-demand imbalance could be created if rural/small town counties were emptying out while fast-growth localities were having trouble keeping up with growth. Similarly, an imbalance could be created if most of the new housing units were vacation homes, weekend getaway homes, or Air BnB rentals.
My intuition tells me that Sturtevant’s analysis is correct — Virginia needs more housing. I’d feel better, though, if intuition was backed by the statistics.

