
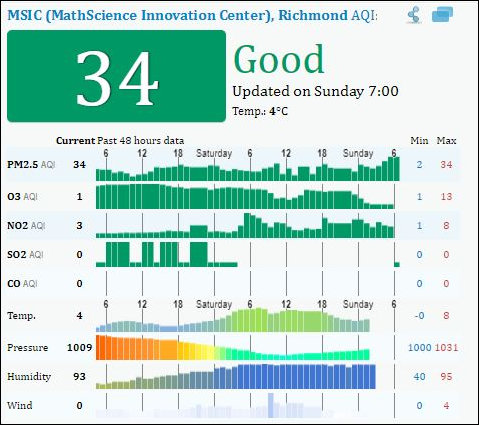
Air quality for Richmond, Va., on Nov. 25, 2018. (Click graphic for larger image.)
In the comments section on Steve Haner’s latest post, Reed Fawell provided an intriguing quote from Oren Cass, a senior fellow with the Manhattan Institute: Environmental Protection Agency regulations have grown so tight, he said, “that Brussels, the capital of the EU, would be the single dirtiest city in the US, if it were here.”
Really? I wondered if that were true. So I checked the AGICN.org website that maps air quality measurements globally, incorporating data for particulates, ozone, sulfur dioxide and nitrogen oxide. As a proxy for Virginia urban areas, I selected an air quality monitor in downtown Richmond (which turns out to be the second highest of 18 measuring Air Quality Index monitoring stations in Virginia.
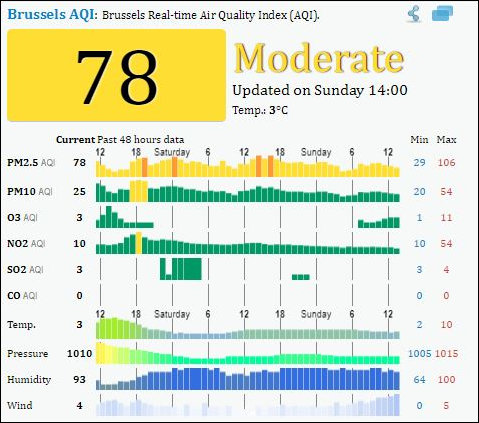
Air Quality Index for Brussels, Belgium.
Lo and behold, it turns out that the AQI for Brussels for the past 48 hours is twice that of Richmond. That’s just a snapshot of one particular point in time. Air quality varies with air pressure, humidity, wind, and temperature, so the comparison may or may not be representative of air quality over a full year.
Recognizing that downtown Richmond may or may not be representative of American cities generally, and Brussels may or may not be representative of European cities, I captured a higher-altitude perspective by comparing maps of the Eastern U.S. and most of Europe. Note: The green markers stand for “good” levels of air pollution, yellow for “moderate,” and red for “unhealthy.”
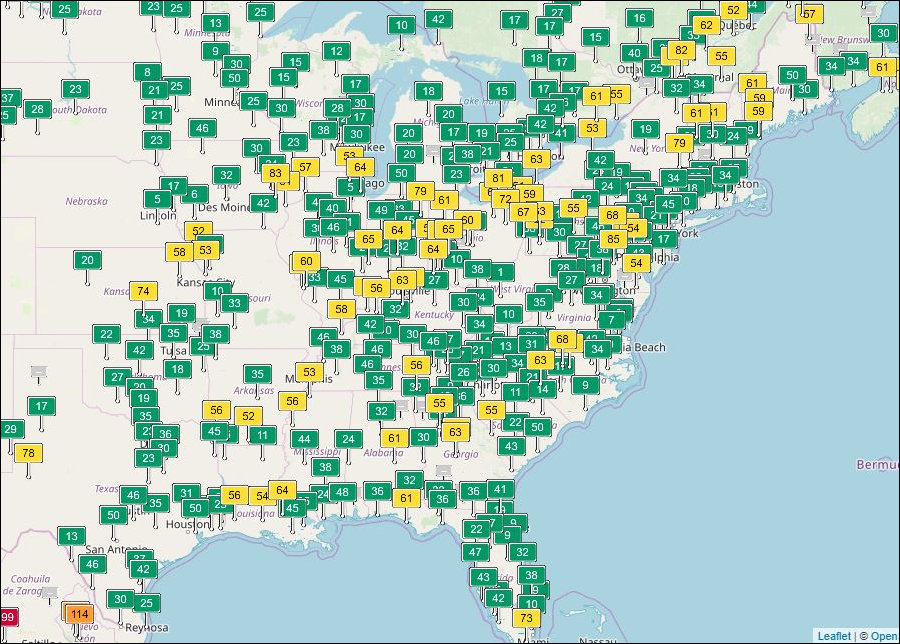 Cass’s statement is almost literally true… but not quite. There are a handful of locations in the U.S. with higher air pollution than Brussels. In the Eastern U.S. only Albany New York had worse air quality, and only by a small margin. Out west, Denver, Colo.; Tacoma, Washington; Long Beach (Los Angeles), Calif.; and Phoenix, Ariz. were somewhat higher. Iowa City, Iowa’s index was significantly higher — high enough to fall under the “unhealthy for sensitive groups” category.
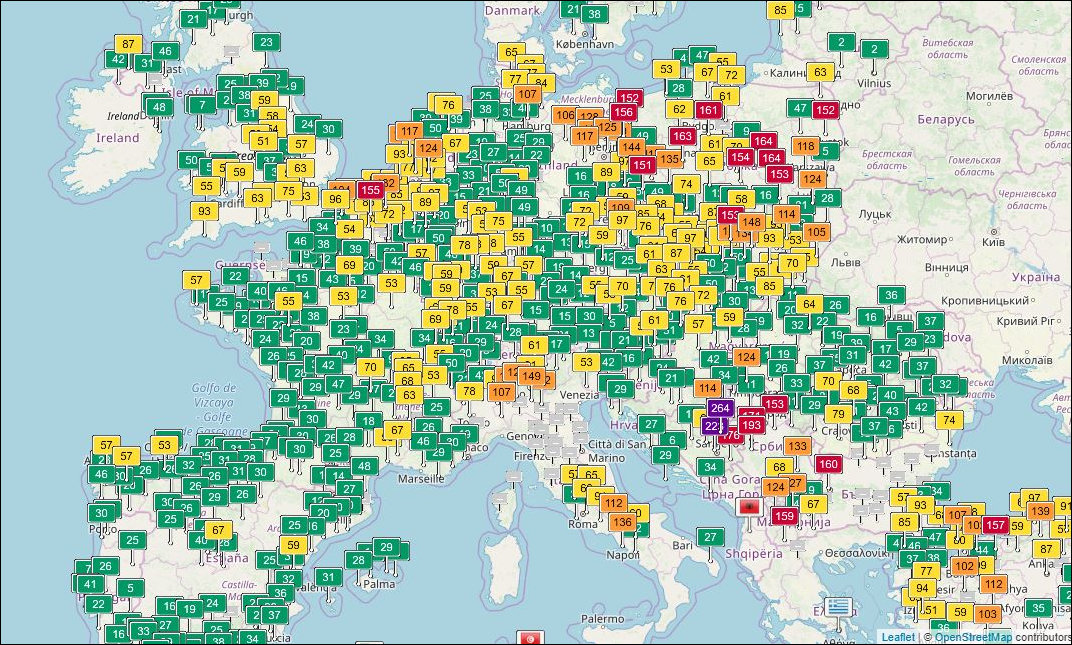 While air quality varies considerably from country to country, there are large patches in Europe where air quality is problematic, especially in the Belgium-Netherlands area, northern Italy, and big chunks of formerly communist countries. Then, for purposes of comparison, here’s a look at Asia:
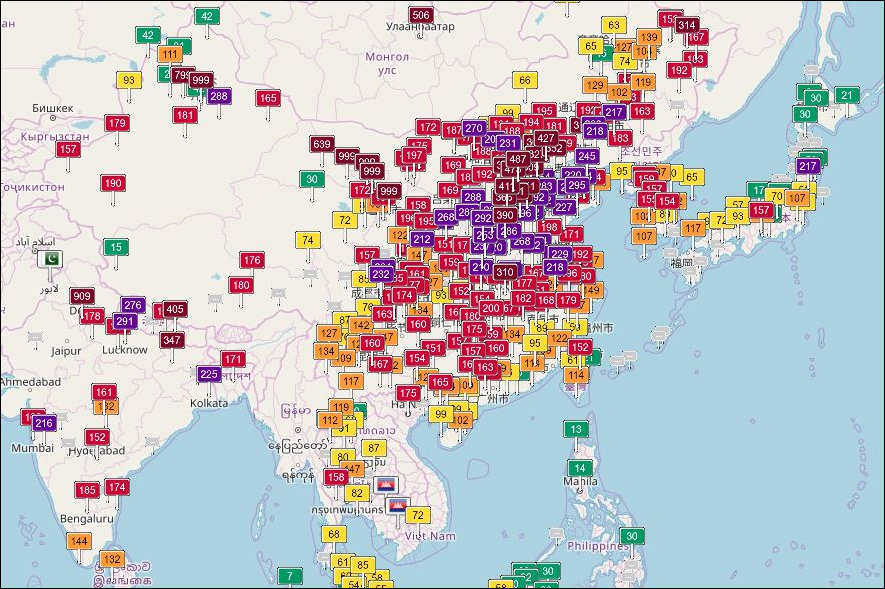 Here we get into the “very unhealthy” and “hazardous” air-quality categories. When air quality rates hazardous, “everyone may experience more serious health effects.” It’s almost (but not quite) fair to say that the U.S. city with the dirtiest air is cleaner than the Chinese city with the cleanest air.
Here’s one more map, this one showing how Virginia stacks up to neighboring states:
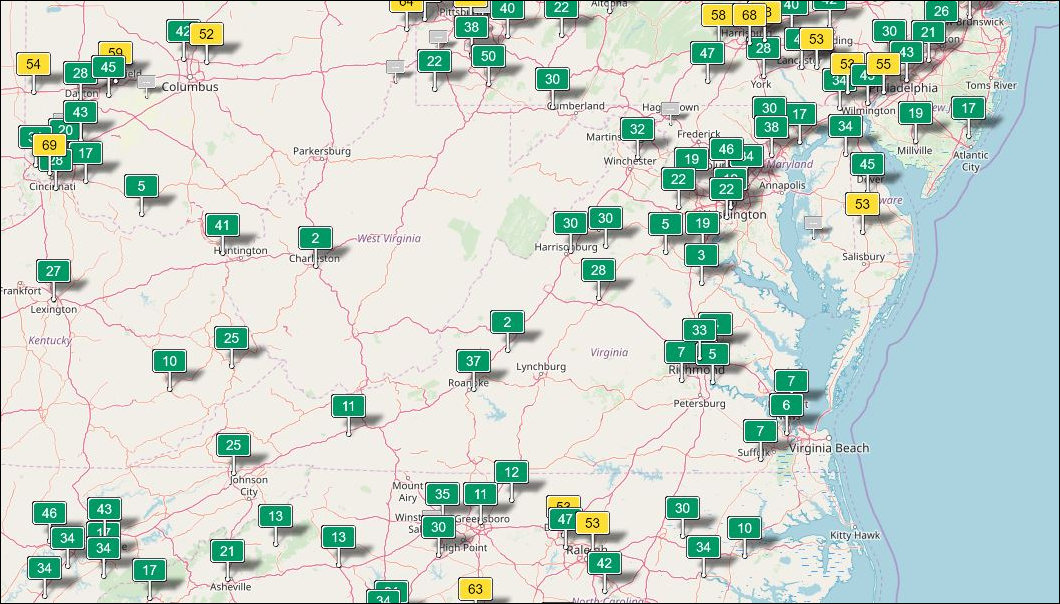
Here you can see Virginia as a relative oasis of low air pollution. Rural air quality is comparable in Virginia and other states, but the Old Dominion stands out (at least in the past 48 hours) as having no monitoring stations recording “moderate” air quality.
This quick-and-dirty survey is too cursory to draw any broad conclusions. But it is suggestive. Sometimes we need to give ourselves a pat on the back. Subject to a more authoritative review, Virginia appears to be doing a pretty good job with its air quality. As coal-fired power plants are phased out in the years ahead, we can expect continued improvements.
This surface skimming of air quality data raises other questions: How clean is clean enough? If Virginia air quality is almost uniformly “good,” that is, posing no health threat to anyone, how much sense does it make to continue investing resources into achieving additional incremental reductions? How much do we gain by tightening air pollution standards on our cars or electric utilities? Should we be focusing more on improving water quality? Or preserving wildlife habitat? Or achieving other tangible environmental goals?

