
by Carol J. Bova
Jim Bacon used an infographic from the Virginia Department of Health (VDH) in his recent post, God, COVID and the Rage Against the Unvaccinated showing the percent of the eligible population in Virginia with at least one dose.
 What the infographic doesn’t say is the numbers are based on Virginians age 12 and up. When you look at another VDH chart by age, you see some pretty impressive numbers from age 35 and up, ranging from 71.0 to 89.9 percent.
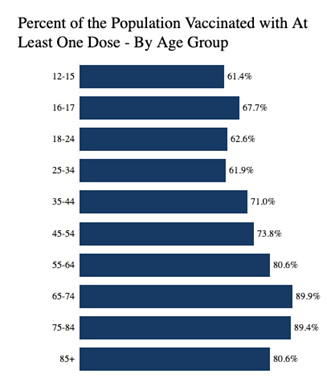

For age 55 and up, fully vaccinated ranges from 73.2 to 83.9 percent. It’s the younger groups with lower averages.
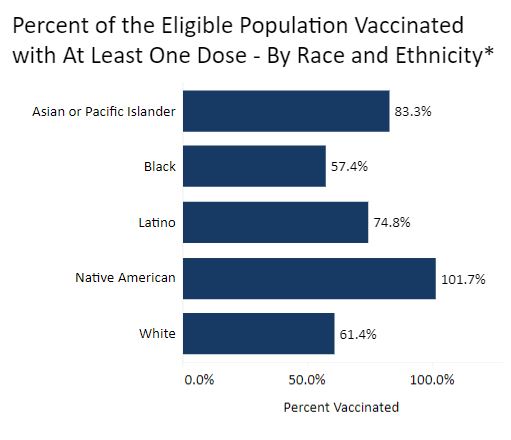
You can see a dataset by age, locality, and partially or fully vaccinated, or a dataset by racial/ethnic grouping by locality and partially or fully vaccinated.
What you cannot see is how age relates to the racial-ethnic group numbers. There’s a huge difference in impact between lower vaccination numbers for 55+ and 12+.
I’ll send an update when VDH responds to a FOIA request for combined age/race-ethnic groups for vaccine doses.

