Source: University of Virginia Institutional Research and Analysis
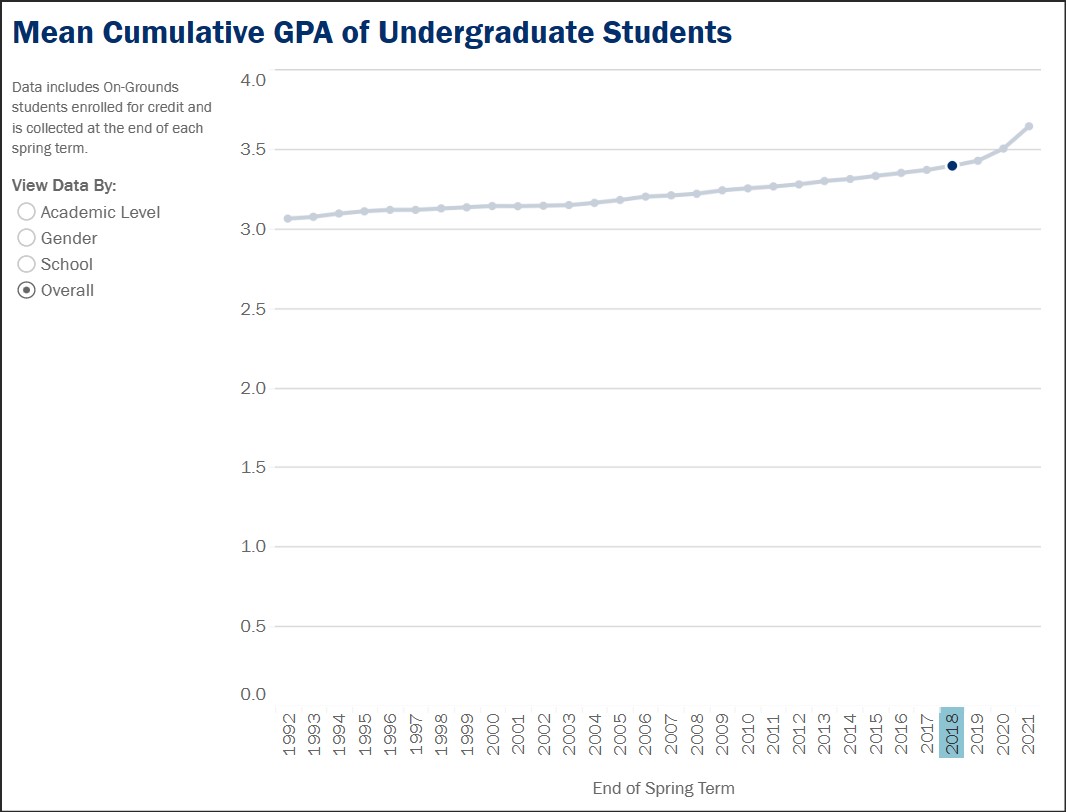
In the spring of 1992, the cumulative Grade Point Average (GPA) of University of Virginia undergraduate students was 3.1, according to data maintained by the office of Institutional Research and Analysis. By 2021, the average GPA had soared to 3.6.
Grade inflation is a national phenomenon in U.S. higher education, so there may be nothing unusual about the long-term trend at UVa.
What does stand out in the chart is how grade inflation has accelerated in the past few years. The dot in the graph represents 2018, the year Jim Ryan became president. The average GPA that year was 3.4. Within three years, it shot up to 3.6. Viewing the UVa data in isolation, however, cannot tell us whether that incipient hockey stick is unique to the University or common to higher-ed nationally.
An average of 3.6 implies that at least 60% of all grades are As — and that assumes that the rest are Bs. If we assume that students occasionally are assigned Cs or Ds, the percentage of As is likely even higher. It would be interesting to see the grade distributions. Unfortunately, UVa does not provide that information. Still, based on the data made public, one must wonder, does anyone ever receive a failing grade anymore?
One possibility is that UVa students today are academic super-achievers who meet standards of academic excellence far more consistently than students in decades past. Another possibility is that the standard of academic excellence is eroding — everybody gets a trophy; nobody should feel bad about themselves.
Inquiring minds in the Board of Visitors might wish to know which is the case. And if standards are lower than in the past, what factors are driving the trend?
The Institutional Research and Analysis website provides a breakdown of the data that yields a few meager clues into what is going on.

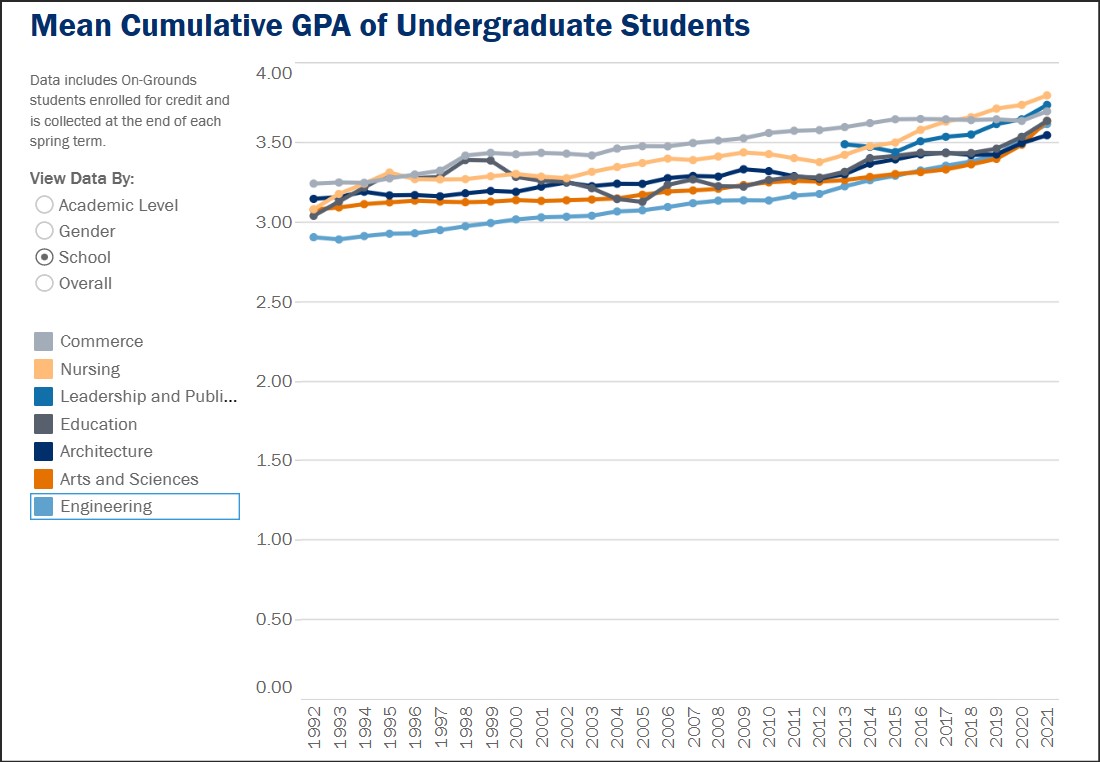
Grade inflation applies to all the undergraduate schools. The median GPA was highest in the nursing school at 3.8 in 2021. The most rigorous (or least un-rigorous) was Architecture at 3.5.
The engineering school, known as the toughest program in the school when I was there a half century ago, has seen the biggest increase in median GPA — from 2.9 in 1992 to 3.6 in 2021.

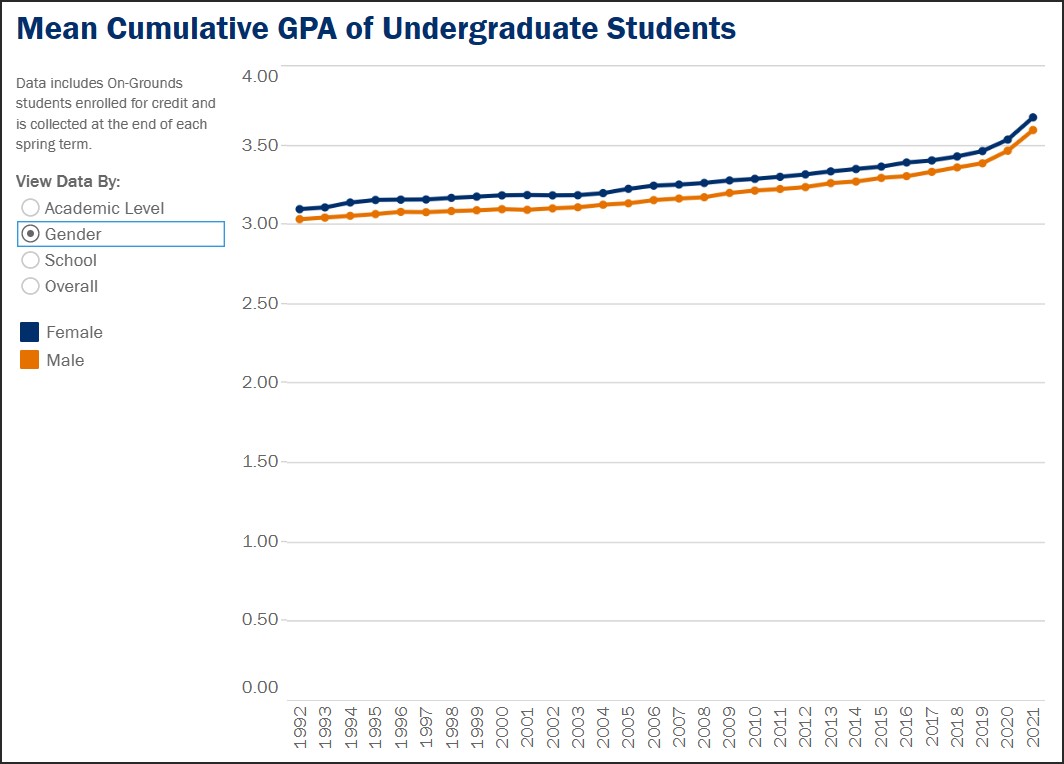
Traditionally, women have earned slightly higher grades on average than men. The margin of roughly 0.1 percent hasn’t changed. But the trend line toward higher GPAs for both sexes has moved in lockstep.
UVa does not break down median GPAs by race/ethnicity.
Conclusion: whatever factors are driving grade inflation, they apply across all disciplines, and they apply equally to men and women.


