
If you want an explanation of why the Richmond Public Schools (RPS) are such a mess, start with the fact that the Richmond educational establishment is in a state of denial, unable to acknowledge reality. Unless Richmond educrats cast off their the false premises under which they operate, the school system will continue to fail the thousands of children, mostly minorities, that it purports to educate.
Richmond educators blame everyone but themselves for the abysmal standardized-test outcomes of its students — racism, not enough money, and in particular the high poverty rate of its school population. We have busted these claims on this blog, but John Butcher at Cranky’s Blog shows how the most recent budget plan perpetuates the self-serving narrative by twisting the data.
Using the free-and-reduced-lunch population as a measure of poverty, the RPS budget notes that the city has the 9th highest free and reduced lunch population, which it documents in the following graph that compares Richmond to “neighboring” jurisdictions:
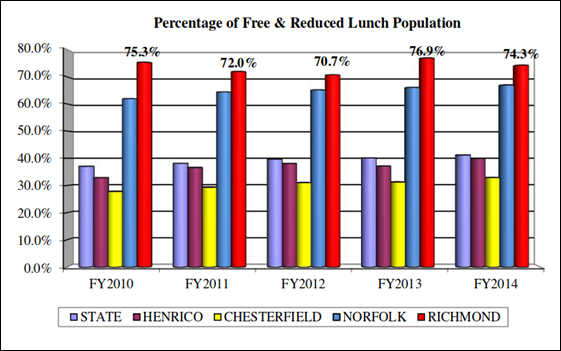
By this reckoning, Richmond has a higher percentage of poor students than any of the jurisdictions to which it compares itself.
The graph, Butcher observes, stops at FY 2014 — four years ago. Why would that be?
Furthermore, RPS uses a narrow definition of poor students. By contrast, Virginia Department of Education (VDOE) classifies students as “economically disadvantaged” if they are eligible for free/reduced cost meals, receive TANF funds, are eligible for Medicaid, or identify either as migrant or homeless. Why would RPS use a narrower definition?
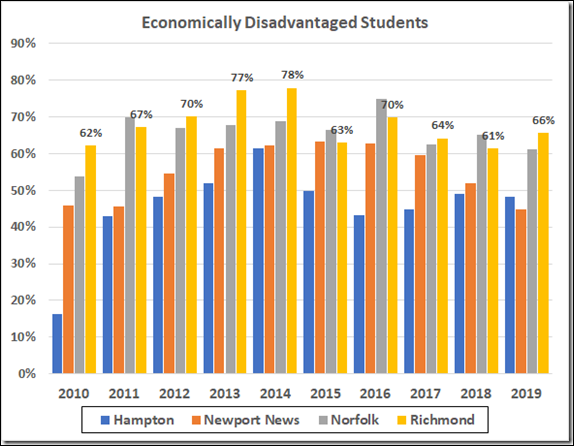
Perhaps because if RPS made the data current to FY 2019 and used the VDOE definition of “disadvantaged,” it would produce a graph that looks like this:
“Do you suppose the School Board’s graph stopped at 2014 because they were just too lazy to update the graph?” asks Butcher. “Or, perhaps, because that was the year that showed Richmond’s largest free/reduced percentage?”
Also, it’s worth noting, The School Board’s graph avoids showing that Norfolk schools have had a higher poverty rate in several recent years.
As Butcher goes on to document in his blog post, compared to other school districts, Richmond schools under-perform in educating both disadvantaged students and those who are not disadvantaged — a point he has made many times before yet has been studiously ignored by RPS officials. While it is true that economically disadvantaged students experience more obstacles to learning, it is also true that they do even worse in Richmond schools than in comparable districts.
The Richmond public school bureaucracy, it appears, has a penchant for shifting blame and refusing to take responsibility for its failures. Until the school board and superintendent acknowledge that a toxic organizational culture is likely part of the problem, nothing fundamental will change.
Update: Cranky has just published a take-down on RPS claims that the high percentage of disabled students is a valid excuse for the system’s academic performance. See his piece here: Mendacious Excuse II.

