Tag Archives: Carol J. Bova

Lies, Damn Lies, and Race-Obsessed Statistics

by Carol J. Bova

A March 3 Virginia Department of Health (VDH) blog post discusses racial/ethnic “health and disease” disparities in light of the COVID-19 epidemic. It states that COVID case rates and hospitalization rates for blacks and Hispanics in the United States and Virginia are substantially higher than for whites.

“Social determinants of health are maldistributed,” concludes the blog post. “These disparities will continue health problem by health problem until there is more equity in the distribution of social determinants of health across racial/ethnic groups.”

Not so fast. There are two problems with this framing of the issue. First, the Northam administration’s obsessive focus on the color of peoples’ skin distracts from targeting the real factors influencing COVID mortality such as rates of obesity and diabetes. The second is that, ironically, VDH isn’t even doing a good job of measuring race. The assertions about differential case and hospitalization rates are based on deficient data. Continue reading

Virginia Ranks 40th of 53 in Nursing Home Ratings

by Carol J. Bova

One of three nursing homes receiving Medicare payments in Virginia (35.3%) scored below average or much below average in the latest Medicare ratings found in the new Care Compare website.

On February 1, 2021, the Centers for Medicare and Medicaid (CMS) updated its ratings report for nursing homes in the United States, District of Columbia, Puerto Rico and Guam. Compared to the ratings before the COVID-19 pandemic, Virginia has reduced the number of facilities with the low 1- and 2-star ratings. Still, Virginia nursing homes ranked 40th of 53 for below and much below average overall quality.

Nursing Home Ratings by State

Who owns these nursing homes? Continue reading

Misplaced Priorities at VDH

by Carol J. Bova

The Virginia Department of Health (VDH) announced January 19 that it has launched a COVID-19 Outbreaks in Virginia Higher Education dashboard. The department included a disclaimer that the dashboard reports only “outbreak-associated cases and not the total number of cases at the college or university.” For more information on COVID-19 numbers, the dashboard points to a separate website hosted by eleven schools which contains information about their cases at www.covid19.va.education.

The VDH rationale for a new dashboard with incomplete information? “This dashboard helps to provide awareness of the spread of SARS-CoV-2, the virus that causes COVID-19, in colleges and universities statewide.”

This new VDH dashboard does not show the true extent of COVID-19 in colleges and universities. It is a waste of time and resources. Having this information at the beginning of the fall semester might have been useful. Citizens are already acutely aware of the spread in their communities, and efforts need to be redirected to the state’s older population.

For example, since November 1:

Colleges and universities have had 13 outbreaks involving 556 cases and no deaths.
Long term care facilities have had 490 outbreaks with 12,024 cases and 1,012 deaths.
Totals for higher ed: 55 outbreaks, 3,026 cases, zero deaths.
Totals for LTCF:  806 outbreaks, 24,935 cases, 2,795 deaths. Continue reading

COVID-19 Infections Up but Flu Infections Down

by Carol J. Bova

The 2020-2021 flu season began with the week ending October 4 – Week 40.  “There have been 2 infections in Virginia during the 2020-21 flu season to date,” the Virginia Department of Health (VDH) said on December 17. By comparison, last year Virginia experienced sporadic cases from weeks 40 through 44, local occurrences in Weeks 45-46, and jumped to widespread cases from Week 47 of 2019 into April of 2020.

According to reports from the Centers for Disease Control (CDC), this flu season, after more than 469,000 tests, there are only 789 recorded cases and 168 deaths in the entire country. News reports in mid-December noted the unusual pattern of low influenza numbers and speculated on the reasons. Continue reading

VDH Outbreak Reporting Won’t Save Lives, Inspectors Will

by Carol J. Bova

Back in June, I asked “Where Are the Other 52 Nursing Homes with Outbreaks?” because that was the number missing from the Long Term Care Facility Task Force dashboard. The Task Force explained it wasn’t involved with group homes and residential behavioral health facilities and, therefore, did not include them in their dashboard — even though those facilities are included in the numbers for the VDH Long Term Outbreaks report.

The new outbreak information dashboard the Virginia Department of Health (VDH) created to comply with HB 5048 of the 2020 General Assembly Special Session Number One will include those groups in the weekly report, VDH announced on its blog December 18. (Summer camps and K-12 Schools will  be listed also.)

The dashboard will include confirmed COVID-19 outbreaks that occurred in medical care facilities, residential or day programs licensed by Virginia Department of Health (VDH), Department of Social Services (DSS), or Department of Behavioral Health and Developmental Services (DBHDS), summer camps, and kindergarten (K)-12th grade schools.

Transparency is always good, but a new report will not address the need for inspectors whose work could actually reduce the incidence and death rates. Continue reading

Southwest VA’s Health Crisis Began Before the Pandemic

This map shows the region served by the Southwest Virginia Health Authority. (From the Virginia Letter Authorizing a Cooperative Agreement)

by Carol J. Bova

The looming COVID-19 hospital crisis in Southwest Virginia was set in motion long before the pandemic.

To begin with, the region’s health indicators and outcomes generally are much worse than the state average. Two indicators particularly impact the COVID-19 epidemic: Every county in the Southwest Virginia Health Authority service area has a higher percentage of obese adults than the state as a whole. Similarly, the diabetes rate in the counties of Lee, Scott, and Wise, and the City of Norton is 19.1%.

Against this comorbidity backdrop, a nursing shortage at the region’s largest health provider, Ballad Health, is making it impossible to staff enough hospital beds to serve Southwest Virginia’s COVID-19 patients. Continue reading

Where Have All the Heart Attacks Gone?

by Carol J. Bova

The Johns Hopkins University News-Letter published an article earlier this month asking, “Where have all the heart attacks gone?” The study questioned whether the U.S. COIVD-19 death rates are being overstated by omitting deaths usually attributed to attacks and cancer. The study was pulled four days later.

Dr. Genevieve Briand, the assistant director for the MS in Applied Economics Program at Hopkins, spoke at a webinar Nov. 11 on “COVID-19 Deaths–A Look at U.S. Data.” She meticulously detailed the facts she used and the conclusion she reached. The hour-long webinar can be viewed here.

Briand showed where and how to access the data from the Centers for Disease Control (CDC). She discussed the annual patterns of deaths in the United States and the reported number of COVID-19 deaths in relation to those annual patterns from 2014 through September, 2020.

Every year, there are recurring peaks and lows in death numbers that apply to all causes of death. She said that because of the emphasis on COVID-19, other major causes of death are being understated. She showed the percentage of total deaths by age categories and how there was no significant increase in deaths of older Americans. Continue reading

VDH’s Data Update Problem

by Carol J. Bova

Governor Ralph Northam and Virginia’s public health officials say they want to “follow the science” and “follow the data” when managing the COVID-19 lockdown. Unfortunately, the data keeps changing.

Last week the Virginia Department of Health made 1,021 changes to the dataset of regional COVID-19 cases by onset date between March and October — adding 1,361 cases to the total. Forty-five percent of the dataset’s 2,258 regional entries from February through October were changed. The VDH dashboard has no footnotes explaining why the changes were made or the source of the new data. Continue reading

Reality Check: COVID Forecasts and Cases


by Carol J. Bova

Since mid-April, 2020, the Virginia Department of Health (VDH) has reported weekly on information from the University of Virginia (UVA) Biocomplexity Institute COVID-19 Model and RAND Corporation. One aspect of these reports is a forecast of weekly cases; another gives date ranges as to when regions are estimated to exceed hospital surge capacity.

Week after week, adapted scenario after adapted scenario, the reports kept advancing the dates when surges would impact hospital capacity. That dire scenario has yet to occur. Continue reading

Update on Virginia K-12 School Outbreaks

by Carol J. Bova

As the COVID-19 epidemic regains momentum this fall, the virus has crept into a few public schools in Virginia. Seven of ten outbreaks in progress are in the Southwest Region where there is significant current and rising community spread. The other three in the Central and Eastern regions where several September school outbreaks have now ended.

The  Virginia Department of Health (VDH) Outbreaks report shows 43 outbreaks in public K-12 schools, with 227 cases, as of Nov. 6. 

The K-12 School Dashboard lists 35 as of October 30th, with October 23 as the most recent date VDH was notified. The total case number for those 35 isn’t known because cases in the two-to-four range are suppressed, showing an asterisk instead. Unfortunately, suppressing those small numbers makes it impossible to see exactly how many cases are involved with the eight new outbreaks and how the number might have increased or decreased since the previous report.

For what the data is worth, here is the list of schools with outbreaks in today’s report, as of October 30th, showing whether they are “in progress,” “closed,” or “pending closure” in the official system.

Continue reading

A COVID Update Before the Winter Surge

by Carol J. Bova

As the election furor dies down, interest will turn to the expected winter surge in COVID-19 cases. Before we get caught up in the onslaught of dire predictions in the news and resultant handwringing over national and worldwide numbers, let’s look at Virginia’s numbers.

Continue reading

The Saga of HB 1774 — Recurrent Flooding and Flooded Roads

by Carol J. Bova

HB 1774 was written to address rural stormwater issues and amended to study stormwater management practices in rural Virginia highway ditches. Why, then, does the bill direct the Commonwealth Center for Recurrent Flooding Resiliency, a group formed to help Virginia adapt to recurrent flooding and sea-level rise, to direct the study?

The Commonwealth Center was created in 2016 to study strategies for adaptation, migration, and the prevention of recurrent flooding — deemed to be caused by global warming-induced sea-level rise — in Tidewater and Eastern Shore localities. As the adage goes, to a carpenter with a hammer every problem looks like a nail. Assigning the study to the Commonwealth Center almost guarantees that HB 1774’s stormwater concerns will be viewed through the prism of sea-level rise and recurrent flooding. And that would be counterproductive because state road and ditch flooding have no connection to sea-level rise at all.

This misdirected idea comes from Lewis “Lewie” Lawrence, executive director of the Middle Peninsula Planning District Commission (MPPDC) and the behind-the-scenes force behind HB 1774. Lawrence has doggedly insisted that Virginia Department of Transportation (VDOT) drainage failures in rural counties bordering the Chesapeake Bay, like my home county of Mathews, constitute recurrent flooding. Lawrence was instrumental in writing, and then revising, HB 1774 in close association with the Virginia Coastal Policy Center of William & Mary Law School for Del. Keith Hodges, R-Urbanna, the bill’s sponsor.

Lawrence has inserted unsupported claims attributing flooding on VDOT roads to sea-level rise in at least nine MPPDC reports since 2009. In the first of these studies, which assessed the human and ecological impacts of sea-level rise upon vulnerable locations in the Middle Peninsula, he used maps indicating that one foot of sea-level rise by 2050 would inundate large portions of Middle Peninsula counties.

Those maps don’t stand up to scrutiny. In one of those reports, the 2050 map for Mathews County reports shows 6.7 miles of VDOT roads in inundated marsh and inland areas, yet fails to show the breach in the Winter Harbor barrier beach that left marshes open to the Bay since a 1978 April nor’easter.

Official projections of recurrent flooding from sea-level rise are based on maps with flawed elevation measurements.

Official projections of recurrent flooding from sea-level rise are based on maps with flawed elevation measurements.

Why is that significant? Because the Chesapeake Bay is connected to the ocean, it reflects the ocean’s high and low tides. The rise and fall of the tides varies from one location to another depending upon the depth of the water and the shape of the coastline, among other factors. Before the nor’easter, a narrow channel at the south end restricted the flow between the Bay and Winter Harbor. The breach in the barrier beach opened the marshes at the north end of Winter Harbor to the tides of the Chesapeake Bay.

The postulated 2050 inundation shown on the map is caused by one foot of sea level rise. But in real life, the daily high tides already run 1 ½ feet to 2 ½ feet, and storm-driven tides can add one or two feet more without having the depicted impact. Nearly three decades after the nor’easter, Hurricane Isabel did cause coastal and inland flooding, but its 7.9 feet of storm surge did not produce the degree of inundation shown for one foot of hypothetical sea level rise in the MPPDC’s map.

Another publication, a September 2016 MPPDC report for the Mathews County Planning Commission, references a 2013 MPPDC study done by Draper Aden Associates (DAA), the Mathews County Rural Ditch Enhancement Study, which said:

One of the primary results of the project was the reaffirmation that poor drainage due to lack of ditch maintenance and sea level rise compounds the flooding problems and flood management solutions utilized within Mathews County.

The supposed affirmation of sea level rise impact in the DAA study was based on flawed LiDAR-derived elevation numbers and an assumed 5-inch sea-level rise in 24 years extracted from the maximum estimate in a 2010 VIMS report to the U. S. Army Corps of Engineers. That VIMS report described “a total possible sea level rise of 0.12 to 0.22 inches per year in the Mathews County area,” or 3 to 5.6 mm a year. (My book, “Drowning a County,” uses 3.5 mm a year based on the Kiptopeke tide gauge trend of 3.48 mm since Mathews has no tide gauge.)

Draper Aden used 2011 Virginia Geographic Information Network LiDAR maps that show elevations of 2 feet for cultivated fields, forested areas, Route 645, and Gullwing Cove Lane — supposedly the same elevation as the marsh to the west. Yet, contrary to what one would expect from these elevations, normal high tides of two feet do not cause any movement of water from marshes and creeks into adjacent fields. Rather, fresh water floods across the roads because it is unable to flow through damaged or blocked VDOT pipes, ditches or outfall streams to nearby water bodies. Continue reading

The Saga of HB 1774 — Starting Over

Del. Keith Hodges, R-Urbanna, discusses VDOT ditch and outfall issues with G.C. Morrow in 2013.

By Carol J. Bova

In the second part of this series, I described how the General Assembly recognized intrinsic problems in HB 1774, a bill designed to remedy deficiencies in stormwater legislation enacted in 2016 and scheduled to go into effect July 1 this year. But instead of killing the bill, legislators passed a substitute.

That substitute, HB 1774 H1, turned from implementation to study, directing the Commonwealth Center for Recurrent Flooding Resiliency to consider alternative methods of stormwater management in rural Tidewater localities.

By passing the substitute, the House and Senate delayed the effective date of the 2016 law and provided more time to work out problems that have come to light.

The Virginia Coastal Policy Center at William and Mary Law School will facilitate a work group for the HB 1774 study. This group will “include representatives from the Virginia Institute of Marine Science, Old Dominion University, the Virginia Department of Transportation, the Virginia Department of Environmental Quality, the Chesapeake Bay Commission, local governments, environmental interests, private mitigation providers, the agriculture industry, the engineering and development communities, and other stakeholders as determined necessary.”

It seems rural residents didn’t make the A-list for this group. That’s a shame because citizen groups have studied water drainage issues in low-lying areas near the Chesapeake Bay, and they learned a few things that the experts overlook. Even the HB 1774 substitute, which aims to fix problems in the original HB 1774… which in turn was supposed to fix the 2016 law…  could turn out to be gravely flawed.

The revised HB 1774 changes the project area from six rural counties of the Middle Peninsula to the 29 counties and 17 cities of Virginia’s Tidewater. If the concept moves beyond the study stage, developers in ten urban counties — Arlington, Chesterfield, Fairfax, Hanover, Henrico, James City, Prince William, Spotsylvania, Stafford, and York — will be able to buy stormwater credits generated by the rural Tidewater counties similar to the way developers can offset the impact of their projects by purchasing credits from a wetlands bank.

The “Tidewater” localities are outlined in red.

Nineteen counties have enough rural locations to establish Rural Development Growth areas along their state roads and highways if they agree to manage the new Regional Stormwater Best Practicies facilities (RSPs). In theory, these facilities will generate enough offset credits to let the RDGs use the current stormwater standards instead of the new, stricter standards, and still provide enough credits to sell to urban developers who need them. If the governor signs HB 2009, which passed the House and Senate, the localities could hire a third party to handle both the RSP management and credit sales on their behalf.


The original bill estimated the it would cost the Department of Environmental Quality $490,000 annually to hire staff to monitor the program for its first five years. But the bill provided no estimate of what expense localities would incur to administer the program, how much developers in urban counties might save, or how much income might be generated through the sale of credits. Presumably, the work group will address these issues. Continue reading

Vehicle Miles Traveled: Where the Action Is

Where Vehicle Miles Traveled has increased the most, 2002 to 2015, as shown on this map of VDOT's transportation districts.

Where Vehicle Miles Traveled has increased the most, 2002 to 2015, as shown on this map of VDOT’s transportation districts.

A few days ago I published a graph showing that Virginia has experienced a modest increase in Vehicle Miles Traveled (VMT) since 2002, but I couldn’t draw any meaningful conclusions. Statewide numbers obscure the traffic dynamics in different parts of the state, and I didn’t have the time to drill deeper.

Inspired no doubt by my sparkling prose, Carol Bova took the trouble to compile the VMT numbers broken down by Virginia Department of Transportation (VDOT)’s nine transportation districts between 2002 and 2015. As the beneficiary of her exertions, I no longer have any excuses.

The data make it very clear: While Virginia roads and highways are getting more congested overall, some are getting congested faster than others. Indeed, some parts of the state are de-congesting (if that’s a word). This should come as no surprise to anyone familiar with Virginia’s demographic trends. The districts with stagnant VMT are experiencing stagnant or shrinking populations.

The overwhelming increase in VMT occurred in the  yellow oval in the map above. Other than an anomalous jump in Interstate traffic in the Staunton district — either Interstate 81 is getting very busy or Northern Virginia’s Interstate 66 commuter shed has leaped over the Blue Ridge Mountains — the overwhelming majority of the traffic growth occurred in just four districts: Northern Virginia, Richmond, Fredericksburg and Culpeper. Those four districts saw an increase of 13.2 million Vehicle Miles Traveled over the 13-year period — four times more than the 3.1 million increase for the other five districts combined.

Even this conclusion cries out for more granularity. The growth in VMT was almost assuredly more concentrated than a glance at transportation districts alone would show. The growth in the Richmond district occurred mainly in the Richmond metro area, not the rural expanse to the south. Likewise, growth in Culpeper and Fredericksburg assuredly took place in the counties in the growth path of metropolitan Washington. (Charlottesville might have added a small kicker for the Culpeper region.)

For all the region’s traffic bottlenecks, the percentage VMT growth in Hampton Roads was modest — on a par with Roanoke/Salem, a less populated transportation district. The Lynchburg district tread water, while the Bristol district lost traffic.

As an aperitif, here is a breakdown of the Vehicle Miles Traveled in absolute numbers (not percentage growth) broken down by transportation district in 2015. While traffic volume may be increasing the fastest in the Culpeper/Fredericksburg exurbs, the districts representing the three main metros — and that includes Hampton Roads — still predominate.

VDOT data exists to drill down locality by locality to confirm or rebut my tentative conclusions. If I ever have the time, I will compare 2002 and 2015 VMT for each Virginia locality and map the percentage increase with Exel’s cool new data mapping software (assuming I can figure out how it works). But don’t hold your breath. My sponsors keep me busy with energy and higher-ed.

The Saga of HB 1774 — Rural Growth, Stormwater Credits

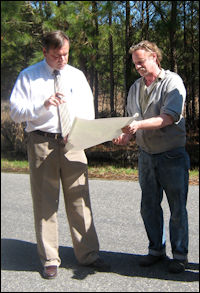
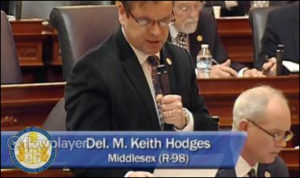
Del. Keith Hodges introducing a substitute for HB 1774.

By Carol J. Bova

Virginia’s part-time legislators saw 3,168 bills introduced in the 2017 General Assembly session according to the Richmond Sunlight website. Inundated with such a volume of legislation, overworked part-time lawmakers are hard-pressed to grind through complex issues.

In such circumstances, speeding bills through the legislature can lead to bad law. And that appears to have been the case with a bill, enacted in the 2016 session, that put into place stormwater management legislation due to go into effect July 1, 2017.

Alerted to deficiencies in that law, lawmakers took up the issue again in the 2017 session. The issues got so ticklish and hard to resolve that legislators threw up their hands and passed a bill that delayed implementation of the original law and gave them a year to reconcile the many conflicting interests.

Del. Keith Hodges, R-Urbanna, took the lead on updating the stormwater law this year. He submitted three interrelated bills, which he wrote with the assistance of the Virginia Coastal Policy Center of William and Mary Law School and the Middle Peninsula Planning District Commission. One of the bills, which allows jurisdictions to outsource administration of the stormwater law to third-party engineering firms, was uncontroversial and sailed through the House and Senate.

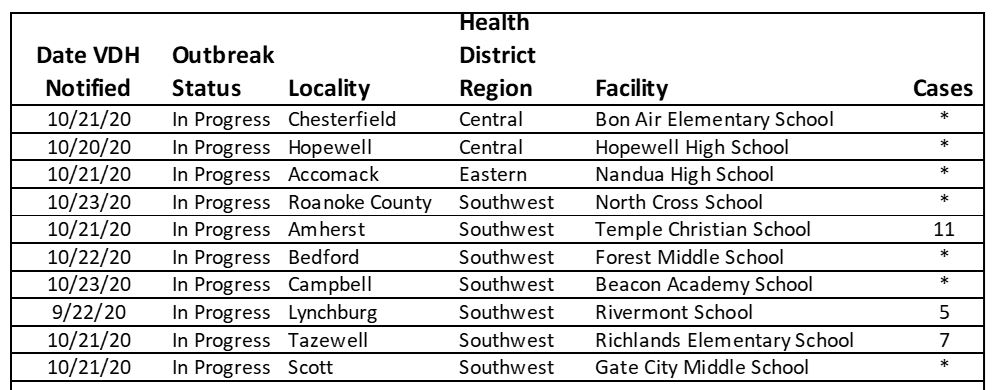
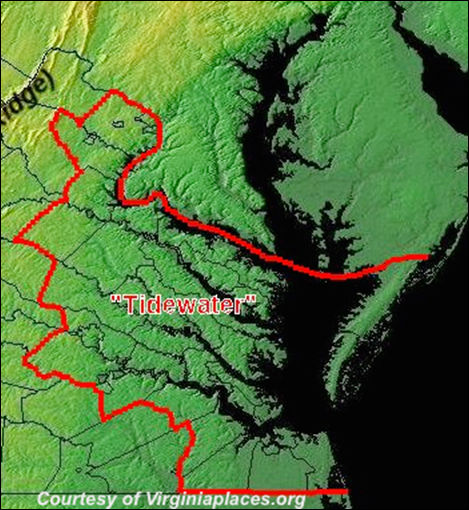
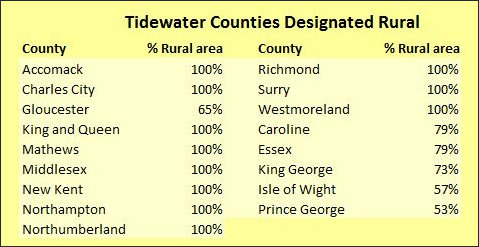
But the other two, HB 1774 and HB 2008, got tangled up in the legislative process. The main sticking point was how to deal with a loophole in the law going into effect in July that set different triggers at which counties had to put into place stormwater management programs. For most of the state, the regulations apply when a project disturbs 10,000 square feet of land up to one acre (at which point the Department of Environmental Quality steps in). But for the 29 counties and 17 cities defined in state law as “Tidewater,” which have the greatest potential to affect water quality in the Chesapeake Bay, the requirement kicked in at 2,500 square feet.

The Virginia Association of Counties (VACo), the lobbying arm of local governments, took the position that the 2,500-square-foot trigger was too onerous and described the closing of the “donut hole” — between 2,500 and 10,000 square feet — as one of its primary objectives of the 2017 session. HB 2008 would have accomplished precisely that.

However, at some point during the session, Hodges concluded that even the 10,000-square-feet trigger was too tough. Counties wanted out because they are not in the business of managing the erosion and stormwater impacts of land disturbance. They would have to add staff and find funding from already strained budgets. Counties with little new construction would not generate enough permit fees to offset the costs when they occurred, while even counties experiencing modest growth had no guarantee new fees would be sufficient.

Accordingly, Hodges withdrew HB 2008.

That left HB 1774 as the main vehicle for fixing the soon-to-be-enacted law. Like the Indian parable of several blind men trying to discern the nature of an elephant, the bill seemingly offered something to all the special interests involved in stormwater management:

  • New business opportunities for engineering firms — if there is a source of funding to create the stormwater management facilities.
  • Improved Chesapeake Bay water quality — if the new Regional Stormwater Best Practices facilities (RSPs), or stormwater banks, work as advertised. (See previous story for details.)
  • New rural economic development — if new RSPs actually do reduce costs for developers.
  • New income for localities from the sale of stormwater mitigation credits to developers — if there is an excess to sell and if there is water to treat in the first place.
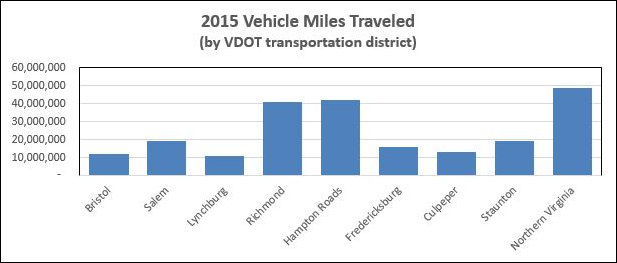
  • Relief for the Virginia Department of Transportation of obligations for roadside drainage by transferring exclusive use of the water in its ditches to new stormwater management facilities — if the water remains in the ditches and if VDOT can ignore the rights of downstream parties to use of the water.
  • Administrative savings for DEQ — if localities agree to take over the stormwater management and if the 2% of fees paid by developers for excess credits offset the $490,000/year extra in salaries for monitoring.

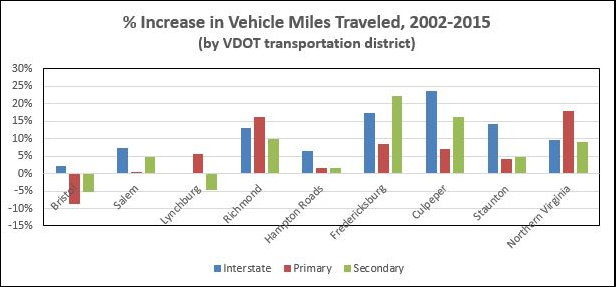
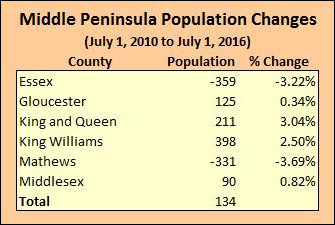
It all works if the system has enough money. Trouble is, rural counties just aren’t experiencing the kind of population and commercial growth to generate the fees to make all these things happen.  The five-year census update estimate from the Weldon Cooper Center calls the premise into question.

Hamilton Lombard with Demographics Research Group at UVA said in the StatCh@t blog :
“While population growth continues or accelerates in most of Virginia’s urban areas, much of rural Virginia will likely continue to experience slow population growth or decline during this decade.”

With all these problems, including the $2.45 million expense to hire DEQ employees to monitor the project, what happened to HB 1774? The House committee didn’t kill it. The legislators requested a substitute bill.

To be continued in Part Three — Starting Over

Carol Bova is author of “Drowning a County: When urban myths destroy rural drainage,” a book documenting VDOT’s neglect of its highway drainage in Mathews County.