

Sussex I State Prison
As has been noted in previous posts on this blog (here and here), the latest three-year recidivism rate of offenders released from the Virginia Department of Corrections (DOC) was the lowest in the nation. In fact, DOC had the lowest rate in the nation for the last three reporting periods. DOC can justly be proud of this record.
Nevertheless, a closer look at the data reveals some troubling trends. Before delving into this data, in order to understand the data and ensuing discussion, there are some terms that need defining and clarifying:
- State responsible (SR)—Generally, only offenders convicted of a felony offense and sentenced to a year or more of incarceration can be housed in a state-run prison. These are the offenders for which DOC is “responsible” and which are included in its recidivism studies.
- Recidivism—DOC uses three-year release cohorts to measure recidivism. Offenders are tracked for three years from their date of incarceration for re-arrest, re-conviction, or re-incarceration. It is important to note that an offender will be counted as a recidivist in the re-incarceration category only if the offender receives a SR sentence. The latest report, issued December 2018, contained the results of the cohort released in FY 2014 and tracked for 36 months, ending in June 2017. When comparing itself to other states, DOC uses the three-year re-incarceration rate because that is the measure that is most common among the states. Forty-three states, including Virginia, use that measure.
Although the Commonwealth had the lowest recidivism rate for the latest cohort, 23.4%, that rate was actually higher than its rate for the previous cohort, 22.4%. Virginia remained first because the states right behind it did not improve enough to surpass the Virginia rate, although one was only less than a half percent behind.
Lest we and the agency get too complacent with data showing that less than a quarter of inmates leaving prison returned, we need to look at the re-conviction data. The re-conviction rate is a better measure of the success of a criminal justice system in returning offenders to society. Whereas the re-incarceration rate used by DOC counts only those offenders who have been returned to DOC custody, the re-conviction rate includes every former offender released from prison who was convicted by a court, regardless of the disposition of the case. The convictions include those for misdemeanors as well as felonies, whether they were sentenced to jail or prison or put on probation.
For the FY 2013 cohort, the re-conviction rate was 48.6, more than double the re-incarceration rate of 22.4%. (The FY 2013 cohort is the latest for which there is complete conviction data available.) The conclusion is that almost half of those released from prison in FY 2013 were convicted within three years of some criminal offense. However, fewer than half of that group committed offenses serious enough to warrant their being sent back to prison.
A more troubling finding is the long-term trend on recidivism rates. Over the past few years, DOC has significantly altered its approach to the treatment of offenders in its custody. Rather than treating incarceration primarily as a means of punishment, the department has increased the emphasis on preparing offenders for their re-entry into society, while still placing security as its first priority. Relying greatly on cognitive behavior treatment methods that have been shown to be generally effective, the department attempts to address the faulty thinking processes that resulted in the inmates committing the offenses in the first place. (As noted recently in the Wall Street Journal, cognitive behavior therapy has long been used to treat additive behavior and has recently been shown to have promise in the criminal justice field.) A great deal of staff training and effort, as well as additional resources, have been devoted to this initiative.
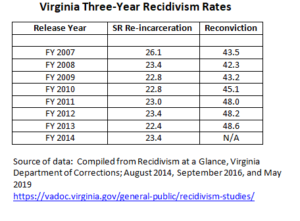
This new emphasis has not yet made much a difference in the recidivism bottom line. As shown in the table below, the re-incarceration rate has barely changed over the last few years, while the re-conviction rate has increased:
It should be remembered that, just as it takes a lot of ocean in which to turn around an aircraft carrier, it takes some time to turn around a large agency with an entrenched culture such as DOC. Harold Clarke was recruited in 2010 by Gov. Bob McDonnell to change the emphasis in DOC, while still maintaining the security of the system. The first re-entry plan became effective in FY 2012. Therefore, inmates in the cohorts released before FY 2012 did not have the benefits of the increased emphasis on re-entry. Furthermore, given the extensive staff training needed to put the re-entry programs in place, combined with resistance from some of the old guard, it could reasonably be argued that the FY 2014 release cohort was the first one be fully affected by the re-entry programs.
Nevertheless, the re-incarceration and re-conviction rates of the FY 2014 cohort were worse than those of the previous group, with the re-incarceration rate being no better than it was for the inmates released in FY 2008 and the re-conviction rate more than 20% higher than FY 2008.
When asked about this failure of increased re-entry programming to affect the recidivism rates, DOC officials offered two explanations:
Jails—Although all SR offenders can legally be housed in a state prison facility, there are not enough prison beds to accommodate all the SR offenders at any given time. Accordingly, a large number and percentage of SR offenders serve all their sentence in a local or regional jail.
Because jails are not designed to hold inmates for long periods of time — less programming space, including education; less visitation; no outdoor recreation; fewer work opportunities, etc. — SR offenders released from jails have a higher recidivism rate than those released from prisons. After controlling for all other factors, DOC has calculated that those SR inmates who serve some of their time in DOC facilities have a recidivism rate of 20-21%, whereas those who remained solely in jail had a rate of 25-27%.
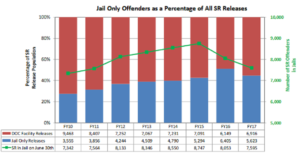
That higher recidivism rate for those SR offenders housed only in jails has been coupled with an increasing number and percentage of SR offenders spending their entire sentence in jails. Because the bed capacity of DOC facilities has remained stable for several years, an increasing proportion of those beds are being taken up by offenders coming in each year with long sentences. The result has been that the increasing numbers of SR offenders with shorter sentences have had to remain in jails. The table below, from the latest VADOC Recidivism report shows how the percentage and absolute number of SR offenders released from jail has increased over the years.
Technical violations—An offender placed on probation supervision must agree to abide with specified conditions. If the offender violates any of those provisions, his or her probation may be revoked by the court and some or all of the suspended sentence re-imposed. This can happen even if the violation does not involve the commission of a new crime. Such cases are commonly called technical violations. The most common technical violation is testing positive for an illegal substance. Other examples of technical violations are: leaving the area (county, city, state) without the probation officer’s permission; missing scheduled appointments with one’s probation officer; not participating in required programming; not searching for a job; and associating with other felons.
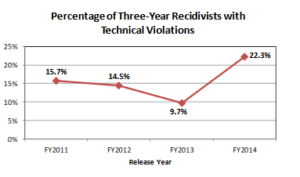
As shown in the table below (from the December 2018 edition of VADOC Recidivism), the percentage of technical violators in the recidivist population more than doubled for the FY 2014 cohort from that of the previous group.
This increase, after several years of decreases, is surprising. As part of its adoption of practices shown to be effective (evidence-based programs), DOC had begun to cut down on the number of technical violators. In response to an inquiry from me, DOC officials did not provide a definitive explanation for the increase. Just as in the public report, the officials could only posit that the increase was “associated” with the opioid epidemic. There have been anecdotal reports that courts are increasingly likely to revoke the probation of offenders who have a history of opioid abuse in order to protect them from overdosing and to get them into treatment. However, no hard data has been produced to substantiate this assumption. Whatever the cause, this increase in recidivists with technical violations is one factor contributing to the increase in both the re-incarceration and reconviction rates.
This increase in technical violator recidivists also has an impact on the jails. The technical violators took up prison beds that could have been used for offenders who were convicted of crimes, but who had to remain in jails, with the lack of re-entry programming. There were 628 inmates returned to prison due to technical violations over the three-year period. Accounting for the “stacking effect” caused by inmates with more than a one-year sentence, this group amounted to the population of a whole prison.
The recidivism data yields other nuggets that would be of interest primarily to other criminal justice data nerds. Therefore, I will not include them in this post, which is probably already too long. (All of the recent recidivism reports can be found here.)
Soapbox Summary: The Virginia Department of Corrections has had the lowest recidivism rate in the country for the last three reporting periods. This is an important accomplishment and one that the department and state should be proud of. Nevertheless, the long-term trend of recidivism has been almost stable, despite significant efforts by the agency in recent years to improve the chances for offenders to successfully re-enter society after serving their sentences.
In light of the increasing number of SR offenders who must serve their sentences in jails and the correspondingly higher recidivist rates for such offenders, the state should consider increasing its prison bed capacity.
One immediate way to increase the number of prison beds available to SR offenders being held in jail would be to decrease the number of technical violators returned to prison. DOC should focus on this population to determine the reasons for its increase and to examine alternative ways in dealing with these offenders.

