
 This is the second in a series examining Virginia’s Standards of Learning.
by Matt Hurt
In the 2013-2014 school year school superintendents in Virginia’s Region VII, a region encompassing Southwest Virginia, began to focus on declining student pass rates during their monthly regional meetings. The Virginia Board of Education had recently adopted more rigorous Standards of Learning in Math and Reading and implemented much more difficult Technology Enhanced Items on those new SOL tests.
School board budgets had been slashed since the Great Recession of 2008. Many central office positions had been merged through reduction in staff, and those who were left had to attend to the administrative requirements of state and federal mandates. Therefore, the superintendents decided to pool their resources and their talents by creating a consortium, the Comprehensive Instructional Program (CIP).
The mission of the CIP was simple: to improve student outcomes as measured primarily by Virginia’s Standards of Learning tests. Initially, data was analyzed to determine which division was the most successful on each SOL test. The most successful teachers of the most at-risk students in that division (as determined by SOL results) were recruited, and they spent the 2014-2015 school year sharing their pacing guides, instructional materials, and assessments, all of which were posted online for others to use. During the first year of implementation (2015-2016), the divisions that used the common pacing guides and common assessments realized greater gains in reading, writing, math, science, and history SOL tests than any other region in the state.
Collectively, the nineteen public school divisions that comprise Virginia’s Superintendents Region VII are the least well funded, have the highest rate of students with disabilities, and the second highest rate of students who live in poverty in the state. When folks hear this, they wouldn’t dream that this is also the region with the highest proficiency rates on Virginia’s Standards of Learning tests, but it’s true. It wasn’t always that way, but it has been for the last few years, thanks to their collaboration.
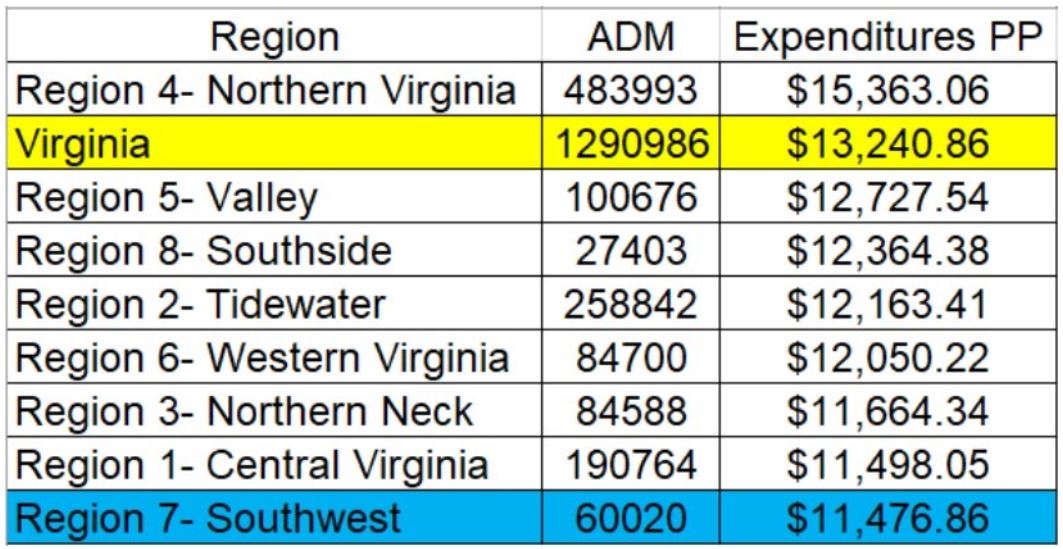
Figure 1. Regional per-pupil expenditures 2020 (most recent data available). ADM = Average Daily Membership (enrollment)
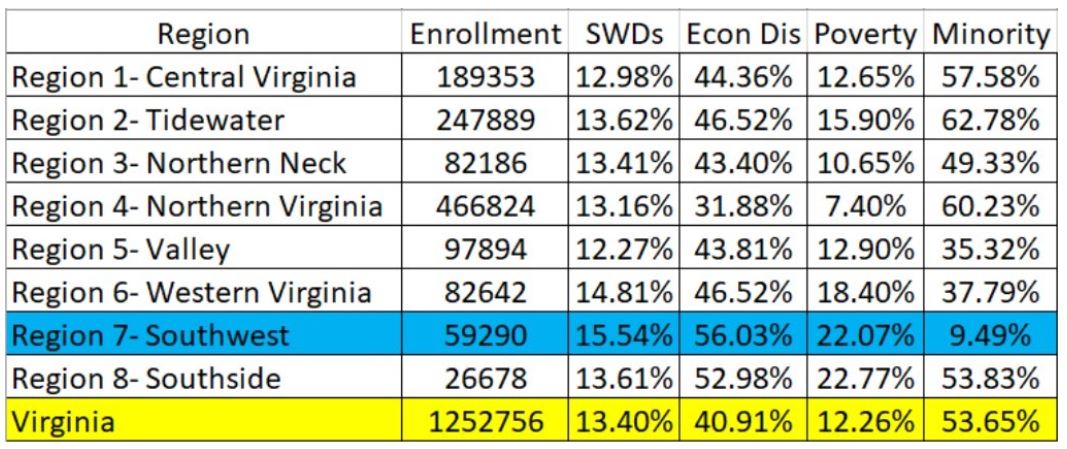
Figure 2. Regional demographics, 2021. SWDs = Students with Disabilities
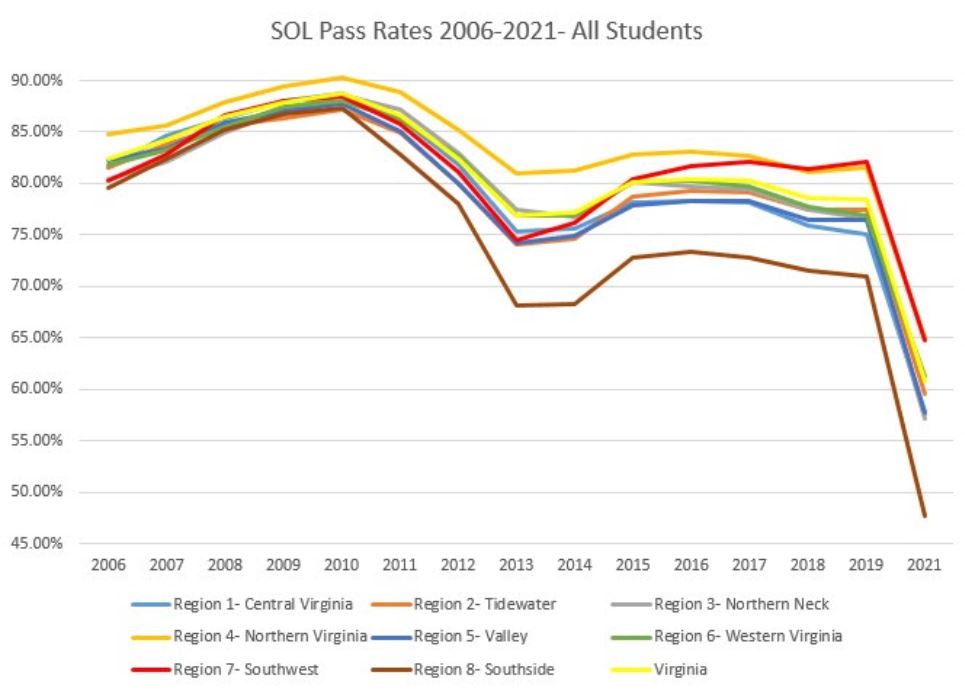
SOL Pass Rates 2006-2021, all students, by region
When folks realized that Region VII had become the most successful region in the state despite also being one of the most disadvantaged, they decided to interview teachers and administrators to ask them what brought about those significant improvements. These interviews produced two very consistent answers from almost all interviews. First, putting teachers in charge of instructional decision making was key. Each year teams of teachers are assembled from across the consortium to make changes to pacing guides and assessments, as well as to decide necessary curriculum updates or anything else that needs to be done to further our mission of improving outcomes for students. What those teachers say goes. The instructional frameworks those teams provide, specifically the common pacing guides and common quarterly assessments were noted as linchpins to the entire process.
Second was noted the consortium’s reliance on data to lead them to better outcomes. Data is collected from SOL tests, benchmarks, state reports, grades, etc. to determine what is working best and share those strategies with everyone else. Relative outcome reports are also distributed to help inform expectations of teachers and administrators. These relative outcome reports help folks to understand that if others are getting it done, they can as well.
One of the most eye-opening uses of data, employed early on, examined the relationship between poverty and SOL outcomes. For years, one would hear the trope “the SOL test is nothing more than a measure of poverty,” and many folks used that to dismiss their students’ subpar performance. Figure 4 displays the interplay between those two variables. The poverty rates (from the US Census Bureau) and the overall SOL pass rates for each division were converted to percentile ranks, and then charted on the scatterplot. Please note that the divisions with the most positive and negative outliers are identified.
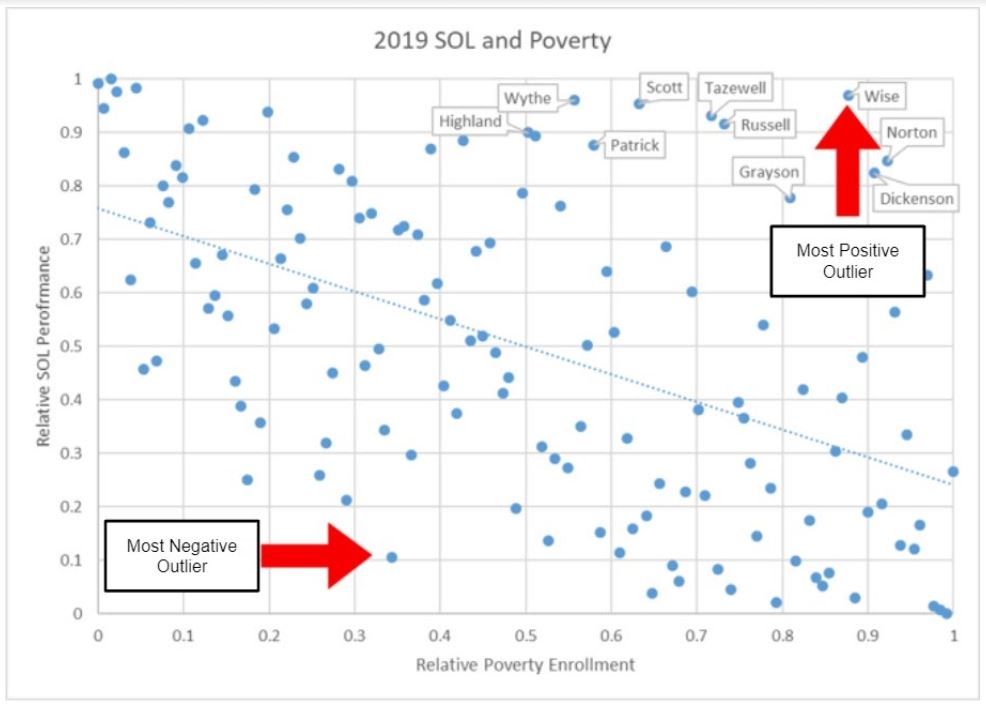
Figure 4. Relationship between SOL pass rates and student poverty.
The most positive outlier enrolled students who lived in poverty at a rate of more than 87% of school divisions in Virginia, yet had SOL pass rates that exceeded 97% of the state. The division that was the most negative outlier had a poverty enrollment that was less than 67% of divisions, yet was outperformed by 90% of divisions on SOL tests that year. The ten named divisions were those that outperformed this trend to the greatest degree. Eight of those ten are in Region VII, and nine of the ten are in the CIP consortium.
When this report was provided to teachers and administrators, and they could plainly see that divisions which had a significantly higher poverty enrollment also earned significantly higher SOL pass rates, they realized that it could be done. Many of these folks resolved to increase the expectations they had of their students and of themselves to rectify this problem, and when they did this, they were able to improve student outcomes. There has been a significant, negative correlation between a division’s relative enrollment of students who live in poverty and relative SOL achievement, but this statistic had been declining from 2014 to 2019. Based on the analysis of the data it appears that Region VII divisions are the driving force which is improving this statistic.
The data from 2021 was skewed in many ways due to our political and educational responses to the COVID-10 pandemic, which will be discussed in great detail in the next article in this series.
Data investigations have yielded other ways in which low expectations have negatively impacted the outcomes for students. This analysis was prompted by examining schools in the consortium that had failed to meet full state accreditation for some time. In all of these schools, an alarmingly high rate of students had earned A’s and B’s for the final grade in a course but failed the SOL test associated with that course. Analysis showed that schools with lower SOL performance consistently had higher percentages of such students than schools with higher SOL scores.
Figure 5 compares the middle school in Region VII with the lowest SOL pass rates to the middle school with the highest pass rates. The table clearly demonstrates that it is easier for a student to earn an A or a B for a course in the bottom-performing school than the top-performing school.
For example, in the bottom-performing middle school, 14% of students who earned an A failed their SOL test associated with that course, compared to 0% in the top-performing middle school. At the top-performing middle school, 56% of students who earned an A for the course scored “pass advanced” on the SOL test compared to only 17% of A’s at the bottom-performing middle school.
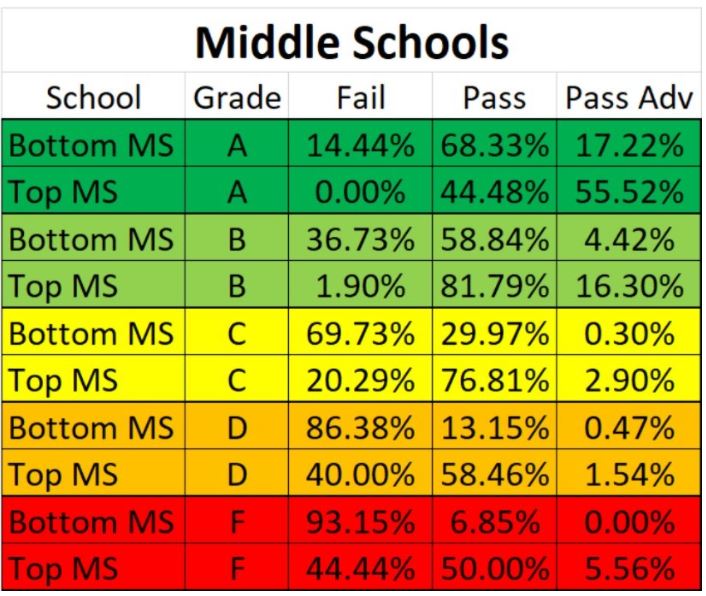
Figure 5. Final Grades and SOL Outcomes. MS = Middle School
This trend is also consistent when reviewing the data for elementary schools, high schools, and the overall school division.
This trend also extends to analysis of subgroup data. In divisions with significantly lower subgroup scores than other divisions, there is a measurable difference in expectations among their subgroups. In those divisions, it is easier for students in some subgroups to earn A’s and B’s, though those students are less likely to pass their SOL tests. These low expectations serve a great disservice to those students. Their performance may look good on their report cards, but their skills as measured by the SOL tests are deficient.
Since 2014, there has been a significant change in leadership philosophy in Region VII. Much of this was born of increased collaboration among administrators, as well as the use of data to replicate strategies from successful schools and divisions. Administrators are much more likely to set expectations for teachers but allow teachers the discretion to make the instructional decisions in their classrooms to best meet the needs of their students. Teacher and administrator evaluations are much more aligned with assessing student outcomes than evaluate inputs as had been the case before.
Rather than spend time monitoring top-down mandates, administrators devote more time working with teachers to understand their problems and remove stumbling blocks that thwart them from being as effective as they can be. Basically, there is much more servant leadership in play because these administrators understand they have to support their teachers, students, and families for student outcomes to improve.
In conclusion, there is no simple algorithm that can be applied to improve student outcomes. Education is a people business and managing people is very much like herding cats. Collaboration, reliance on data, problem solving, and focus on the main thing seem to be the keys that have helped one of the most disadvantaged regions in the state to be the most successful.
Matt Hurt is director of the Comprehensive Instructional Program based in Wise.

