
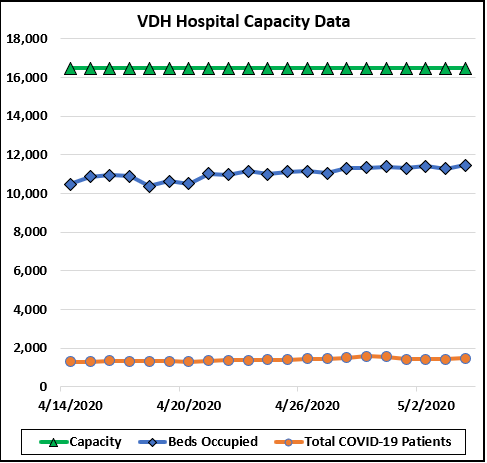
John Butcher has created two new graphs that allow us to visualize the capacity of Virginia hospitals to handle the COVID-19 epidemic. The graph above compares the number of COVID-19 hospitalized patients to the total number of occupied beds and the total number of hospital beds in Virginia. Clearly, there s abundant excess capacity in the system — more than enough to accommodate a jump COVID-19 patients if the virus spreads more rapidly as Governor Northam relaxes emergency shutdown measures..
The chart below provides a breakdown of hospitalized COVID-19 patients, comparing the total number to the number in ICUs and on ventilators.
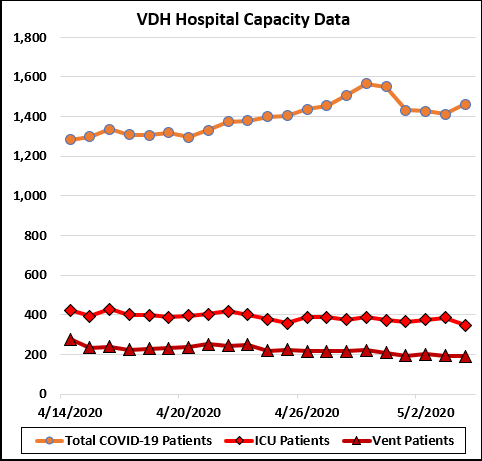
Once again, there’s plenty of capacity to spare.

