
Source: Virginia Public Access Project
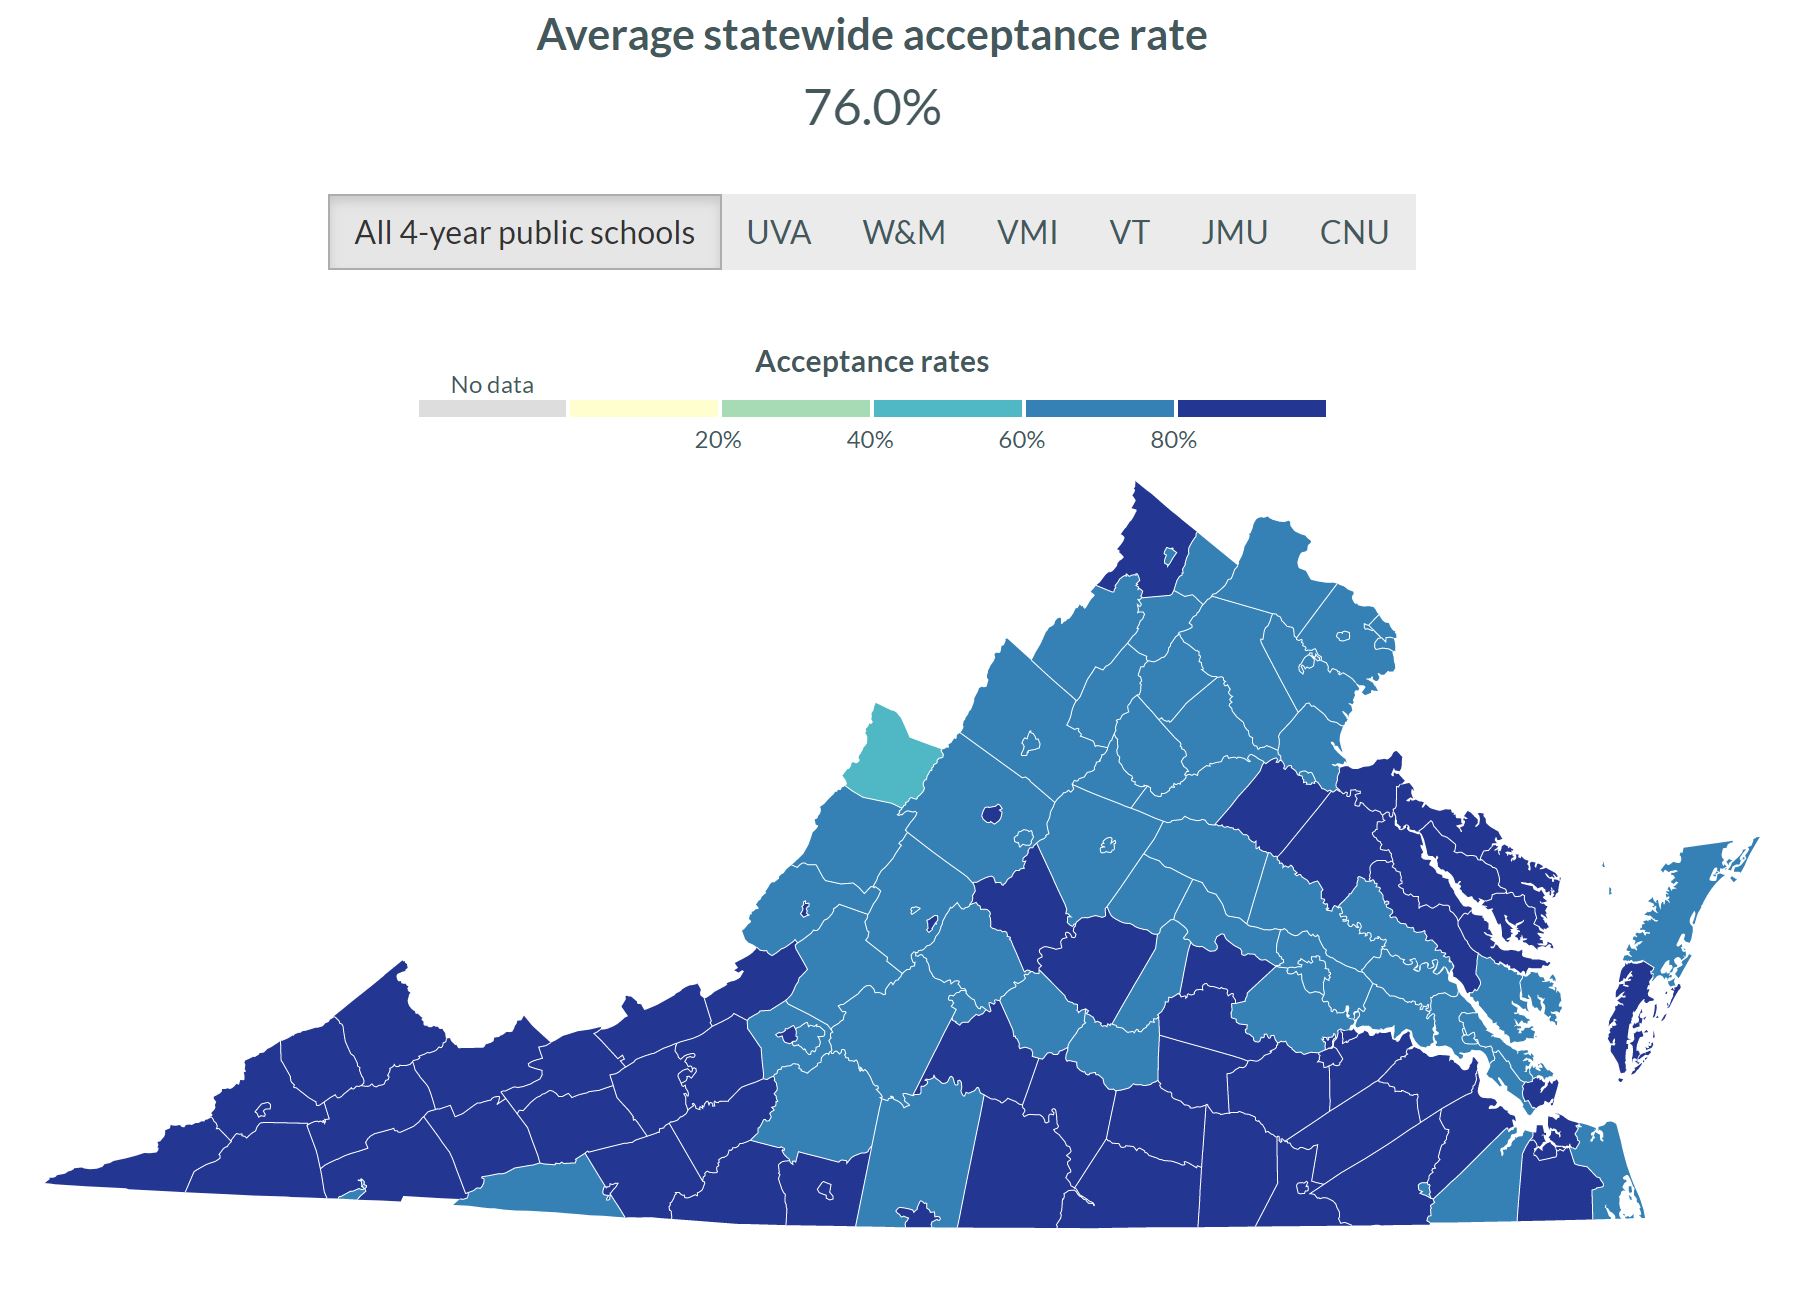
If you’re applying to one of Virginia’s four-year colleges, you stand the best chance of being admitted if you come from a non-metropolitan area, judging by this map compiled by the Virginia Public Access Project on the basis of recently published State Council of Higher Education for Virginia data. The odds are best of all if you come from one of Virginia’s coalfield counties.
Of the 74 students from Dickenson County who applied to a Virginia college in the 2019-20 and 2020-21 academic years, 97.4% were admitted somewhere. That compares to a 71.1% admittance rate for Fairfax County students. On the other hand, the number of Fairfax students applying to college was immeasurably larger — more than 22,000.
So, what’s going on? Are Virginia colleges predisposed to cut kids from poor rural areas more slack? Are kids from poor rural areas more qualified? Or do only the brightest kids from poor rural areas aspire to higher education and bother to apply?
Consider this comparison. Wise County, which adjoins Dickenson, has about 2.6 times the population. But 533 Wise County graduates applied to college — about 7.2 times the number (and were accepted at a 93.4% rate). That suggests there may be considerable variability in the aspirations of high school graduates. Perhaps socioeconomic status is a factor. The median household income in Wise is higher than in Dickenson — $38,000 compared to $30,000 per year — even though both counties are tied to the declining coal economy. Or maybe Wise County schools set higher expectations.
If you’re interested in these kinds of questions, check out the VPAP data display here. You’ll find not only the acceptance rate for all four-year colleges but for the state’s six most selective schools. For what it’s worth, Dickenson County sent a grand total of one student to the University of Virginia during the two years included in the database, compared to 2,606 from Fairfax County.
— JAB

