
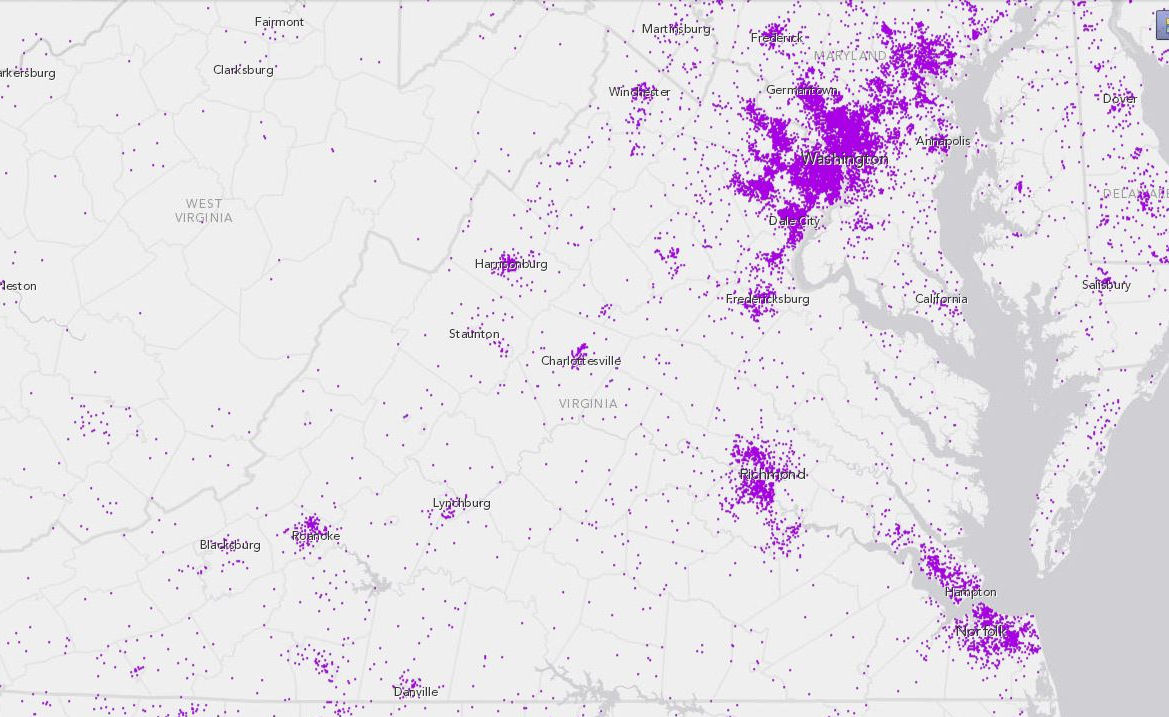
Distribution of Spanish speakers in Virginia. Each dot represents 50 people. (Click for larger image.)
Data geeks should have fun with a new interactive map published by the U.S. Census Bureau, which maps the distribution of speakers of 15 non-English languages across the United States. The data comes from the latest American Community Survey data.
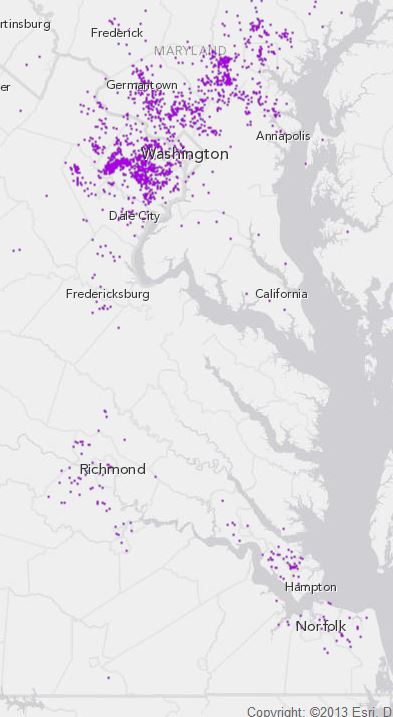
Distribution of Korean speakers. (Click for larger image.)
No surprise that Spanish is the top non-English language spoken in Virginia. That’s followed by three Asian languages — Chinese, Vietnamese and Korean. (They are roughly comparable in number. It’s hard to eyeball the ranking based upon the map display.)
I was surprised to find a significant number of French speakers in the Old Dominion. Some undoubtedly are from France itself but I would guess that most hail from West Africa or the West Indies. There is a fair representation of Arabic, Persian (Farsi) and Tagalog (Filipino) speakers in the state. Needless to say, the largest concentrations are found in Northern Virginia. The Washington metro region is one of the nation’s larger magnets for immigrants.
One cool feature allows you to see the difference between those who speak a language, and those who speak the language and don’t speak English very well.
— JAB

