
 by Dick Hall-Sizemore
The 2022-2024 budget proposed by Governor Northam includes $8.6 billion in general fund appropriations in the first year and $8.3 billion in the second year for state assistance to local K-12 programs. These amounts are a little more than a quarter of the entire general fund budget. Compared to the appropriation for the current fiscal year, these proposed amounts are an increase of $1.3 billion (18.2 %) in the first year and $1.0 billion (14.3%) in the second year. It is easily the largest budget proposed for public education in the state’s history.
The details of state funding for public education can be mind-numbing; they take up more than 40 pages of closely-spaced type in the proposed budget bill. Those details are known and understood by only a relative handful of individuals in and around state and local governments.
State financial assistance for K-12 is provided in four basic categories: Standards of Quality, Incentive Programs, Categorical Programs, and Lottery Proceeds. The Standards of Quality (SOQ) category is, by far, the largest, constituting more than 80% of the total each year. This article is a high-level overview of SOQ funding and a subsequent installment will cover the other aspects of state funding.
Standards of Quality
Background
The Virginia Constitution directs the General Assembly “to seek to ensure that an educational program of high quality is established and maintained.” (Article VIII, Section 1)
It is important to note that the constitution does not attempt to define what should constitute such a system. Rather, it requires the following steps to be taken:
- The Board of Education shall determine and prescribe “standards of quality” for the school divisions, subject to revision by the General Assembly;
- The General Assembly shall determine the manner in which funds are to be provided to maintain the program prescribed by the standards of quality;
- The General Assembly shall provide for the apportionment of the cost of such program between the state and the local units of government; and
- Each local unit of government shall provide its portion of such costs.
The SOQ funding methodology was developed in the mid/late 1980s and has remained largely in place since then. The following policy decisions form the basis of the methodology:
- The SOQ is the minimum educational program that school divisions must provide;
- The state will fund its share of this minimum cost only. Anything provided by local school divisions above the minimum must be funded entirely by them;
- The state will fund, on the statewide level, 55% of the cost of maintaining the SOQ;
- The actual proportion funded by each locality will vary, based on the locality’s ability to pay (composite index);
- The state share for each locality will be distributed on the basis of average daily membership (ADM).
The Appropriation Act sets out various accounts, or categories, for the SOQ, each of which has a line-item appropriation. The largest category is basic aid, which includes the funding for the 51 professional staff per 1,000 pupils required by the SOQ, along with support costs. With some exceptions, the basic approach is to calculate a division’s total cost related to SOQ, using statewide prevailing costs and the division’s average daily membership. With that total cost in hand, the amount that the state will provide toward this total cost is determined by the locality’s composite-index score.
Total costs
Some costs have an established standard. Personnel fringe benefits would be one example. Another example would be textbooks. The proposed budget bill stipulates $132.38 per pupil for textbooks.
For those items for which there is no established standard, primarily salaries, the formula uses “prevailing cost.” That amount is calculated “using the ‘linear weighted average’, a weighted average giving greatest weight to division costs closest to the median cost (up to a weight of 5), and least weight to division costs closest to the highest and lowest outlying values (down to a weight of 1).” Based on this calculation, the proposed budget bill sets out the following “statewide prevailing salary levels”:
- Elementary teacher–$53,996
- Elementary assistant principal–$75,435
- Elementary principal–$93,869
- Secondary teacher–$56,977
- Secondary assistant principal–$81,093
- Secondary principal–$102,844
- Instructional aide–$21,304
Thus, the prevailing cost for an elementary school teacher is the same in Lee County as it is in Virginia Beach. As an overview of SOQ funding dryly notes, an individual school division’s “actual costs can be above or below the linear weighted average values used for SOQ funding.”
It needs to be noted that the proposed budget bill does provide that “cost of competing” adjustments of 9.38% for instructional personnel and 18% for support personnel be applied to the cost of school divisions in Planning District Eight (Northern Virginia) and the counties of Accomack and Northampton. (The Eastern Shore counties had not been included in this provision in previous Appropriation Acts.) Furthermore, it provides that the prevailing costs for school divisions bordering Planning District Eight be increased by 25% of the cost of the competing adjustment provided for Northern Virginia divisions. (The localities eligible for this lower cost-of-competing adjustment are the counties of Stafford, Fauquier, Spotsylvania, Clarke, Warren, Frederick, and Culpeper and the cities of Fredericksburg and Winchester). As a result, the funded cost for an elementary teacher in Fairfax County is $59,421 and, in Spotsylvania, $55,324.
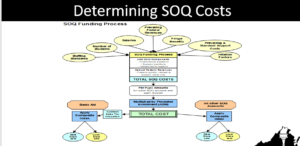
To determine a division’s cost in a SOQ category, or account, DOE calculates the instructional costs, using the staffing standards set out in the SOQ and the prevailing cost. It then calculates the costs for any factors related to that category. The SOQ costs are funded in several categories, including basic aid, textbooks, special education, gifted education, etc. Each category has its own formula. Basic aid is the largest and most complex category. The total cost of all those categories is the total SOQ cost.
An example of the basic aid methodology best illustrates the process. Based on its projected average daily membership, the basic aid formula determines that Spotsylvania County would have 616.01 funded elementary school teachers at a funded cost of $34.1 million in the first fiscal year of the next biennium. That sort of calculation is made for each of several categories of instructional personnel, as well as for equipment, transportation, and support personnel to arrive at a total SOQ cost for basic aid of $156.5 million. Dividing that amount by the projected ADM and adding in a couple of adjustments yields a per-pupil allowance for basic aid of $6,962. When that amount is multiplied by the projected March 31 ADM, the total cost of basic aid comes to $161.9 million.
For the basic aid category only, the total cost is adjusted by subtracting the distribution of sales tax revenue to the locality. For Spotsylvania, that would be $32.8 million, leaving a net basic aid cost of $129.1 million. That amount would then be allocated by the county’s composite index to determine the state share ($81.7 million). Similarly, the total costs calculated for each of the other SOQ categories would be allocated by using the composite index. The total of all the various SOQ accounts would be the total SOQ funding from the state for the county ($147.1 million).
Here is a picture of the SOQ funding methodology:
Composite Index
The composite index is the mechanism used to implement the constitutional directive to “apportion” the cost of SOQ programs between the state and localities. It is a measure of each locality’s financial resources relative to state average values and, as such, can be considered an indication of a locality’s ability to pay. In addition to being used to determine a locality’s matching amount for SOQ programs, it is also used to determine the state/local split on other direct aid to education programs.
Three factors are used to construct the composite index:
- True value of real property in the locality (weighted 50%)
- Virginia adjusted gross income in the locality (weighted 40%)
- Taxable retail sales in the locality (weighted 10%)
Following are the steps used in constructing the composite index:
- Each component is expressed on a per-capita basis using local population (weighted 33%) and on a per-pupil basis using ADM (weighted 67%);
- The index value for each locality is the local per capita/per pupil values as a proportion of the corresponding statewide average values.
- The formula is adjusted so that the statewide average local share is 45% and the statewide average state share is 55%. Each index value represents the percentage of formula costs that must be funded from local funds. Examples: the composite index of Halifax County for the upcoming biennium is .3076, which means that the county will be responsible for 30.76% of its SOQ costs and the state, 69.24%. Conversely, Fairfax County will have a composite index of .6532, resulting in the county paying 65.32% of its SOQ costs and the state, 34.68%.
- Any index is capped at 0.80, meaning that the most that any locality will pay toward its SOQ costs is 80%, with the state paying the remaining 20%.
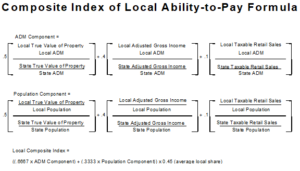
Source: Virginia Dept. of Education
The composite index scores for the upcoming 2022-2024 biennium range from .1714 to .8000. Nine localities have the highest composite index of .8000. They are:
- Arlington County
- Bath County
- Goochland County
- Lancaster County
- Rappahannock County
- Surry County
- Alexandria
- Falls Church
- Fairfax City
The five localities with the lowest composite index scores are:
- Lee County–.1714
- Scott County—.1893
- Buena Vista–.1942
- Hopewell–.2022
- Henry County–.2179
The inclusion of several rural counties in the list of localities with the highest composite index scores may come as a surprise to some. To understand this result, one must keep in mind that the composite index is based on relative values.
The reasons for high composite indexes vary somewhat from county to county. The tables below illustrate how the process plays out.
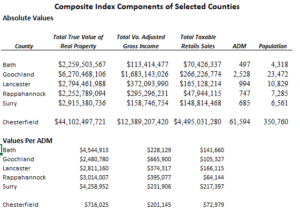
Source of data: Virginia Dept. of Education
The first table lists the total true real property value, total adjusted gross income, taxable retail sales, and ADM in each of the five rural counties with a composite index of .8000. For comparison, Chesterfield County is also included. Its composite index, .3546, is the median value.
The second table shows the value of each component per ADM for each locality. Thus, although the total value of real property in Chesterfield is almost 20 times higher than that in Bath County, the former locality has about 124 times the number of students.
The ratio of total property value per ADM is the most heavily weighted factor in the calculation of the composite index. Close behind is the ratio of AGI per ADM. Due to a combination of high total property value as a result of being the home of significant taxable Dominion Energy facilities (Bath and Surry), extensive, expensive waterfront property (Lancaster), or large expensive rural estates (Goochland and Rappahannock); high AGI; and low, or relatively low, ADM, these rural counties are rated, along with Arlington, Alexandria, Falls Church, and Fairfax City, as having the highest ability of all Virginia localities to pay their share of SOQ costs.
As is the case for many such formulas, there is a lag in the data for the components of the composite index formula. 2019 is the base year of the indicators of ability-to-pay (property value, AGI, and retail sales) for the 2022-2024 composite index scores, and the March 31, 2020 ADM and 2020 census are the population data sources. For a listing of all the composite index scores by locality, see here.
State sales tax
The second largest component of SOQ funding, and of state funding of public education, in general, is the assigned portion of the revenue collected from the state sales tax. The proposed budget bill for the 2022-2024 biennium includes an estimate of $1.7 billion in FY 2023 and $1.6 billion in FY 2024. Unlike other sources of funding, which are distributed based on ADM, most of this revenue from the state sales tax is distributed by school-age population. The Appropriation Act treats these sales tax proceeds as part of the locality’s share of the cost of basic aid. Accordingly, after the total SOQ cost for basic aid is calculated for a locality, the projected distribution of sales tax revenues is deducted from that amount before the composite index is applied to determine the state and local shares of the cost. That action effectively reduces the amount of general fund appropriation the state must provide toward the SOQ cost.
Rebenchmarking
Every two years the Department of Education updates the SOQ funding formula and the composite index. This “rebenchmarking” is a technical exercise. It does not change the components of the formulas, just the cost and enrollment figures that are entered into the formulas.
Most of the data elements are fixed for the biennium. These include the funded salary amounts and the initial fall membership and ADM data that are used in the SOQ model. (The actual distributions are based on the annual March ADM.)
The rebenchmarking is always one of the major drivers of the increases in the biennial budget bill. For the 2022-2024 biennium, DOE estimated the cost of rebenchmarking would be $153.8 million for FY 2023 and $177.2 million for FY 2024, a $331 million increase for the biennium, which the Governor included in his introduced budget. There were 31 separate items that were updated, some increases and some decreases, to arrive at the final figure. The most significant ones were related to enrollment increases and increases in salary costs. More details on rebenchmarking can be found here by clicking on the appropriate document for the Oct. 22, 2021, meeting.
The composite index scores for each division are also updated during the rebenchmarking process. The most recent data for total true value of real property, total Virginia AGI, total taxable retail sales, ADM, and population are used. As a result of the rebenchmarking for 2022-2024, the composite index for 64 localities decreased, meaning they will be responsible for a lower percentage of their SOQ costs. Sixty-two localities will have a higher composite index; eight will remain unchanged.
The three localities that will experience the greatest increases in their composite indexes will be Greensville County, Powhatan County, and the city of Richmond. These increases can have a significant fiscal impact on a locality. For example, due primarily to significant increases in property values and AGI over the last two years, the composite index for the city of Richmond will increase by .0451. The city estimates that this increase will result in a loss of about $10 million annually in state revenue. That loss would be in addition to a $20 million reduction anticipated in SOQ funding due to a decline in student enrollment.
The new composite index for each locality, as well as a tab that shows the change for each locality, can be found here.
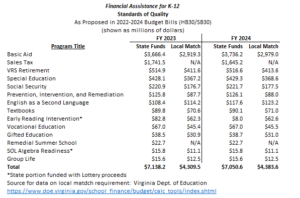
The table below lists all the SOQ “accounts” and their appropriations for each year of the upcoming biennium. (Note the table was updated on 1/12/2012.)
Next installment: Non-SOQ financing for public education
The main sources for this article were:
- Overview of Virginia’s K-12 Funding Formula. Powerpoint presentation by Kent Dickey, Deputy Superintendent of Budget, Finance, and Operations. Found here.
- Various tables showing the distribution of aid by division, here.
- Item 137 of the 2022-2024 budget bill.
- Responses by VDOE staff to emails from me, asking questions and seeking clarifications.

