
 by Dick Hall-Sizemore
Note: This is the second installment of an overview and discussion of state financing of K-12 education in localities. Part 1 of this series was an overview of financing related to the Standards of Quality.
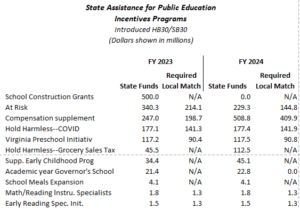
The Standards of Quality is the major category through which the Commonwealth provides financial assistance for public education, but there are other important sources as well. These are: incentive programs, categorical programs, and lottery-funded programs. Together, the introduced budget bill would provide $2.3 billion in FY 2023 and $2.0 billion in the second year in these categories for local school divisions.
Two aspects need to be noted. First, the total amounts to be distributed are estimates. The actual amount of lottery profits is likely to change and, therefore, the amount of funding available for distribution to school divisions will change accordingly. Second, participation in these programs by school divisions is optional. A school division does not have to participate in the Virginia Preschool Initiative or the Early Reading Intervention programs, for example. But, if it does choose to participate and receive the funding available, it must provide the local matching funds, if required, and abide by all the other conditions set out in the Appropriation Act and Department of Education (DOE) guidelines.
Incentive programs
This category includes funding that the state provides for special needs, some of them ongoing and some of them related to temporary circumstances. Therefore, the total funding for this category will vary from biennium to biennium. For example, in the current fiscal year, the Appropriation Act provides $710.3 million. In contrast, for the first of the next biennium, the total amount for this category is more than double that amount, at $1.5 billion, and 72% percent more in the second year, $1.2 billion.
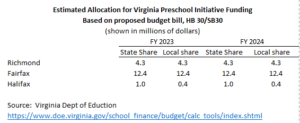
Following are short descriptions of the largest items in this category. To illustrate the amounts involved for individual districts, and the effect of the use of the composite index, I have used three jurisdictions. The choices are not random, but they represent three different types of jurisdictions with a range of composite indexes, shown in parenthesis: Richmond, a city with a large minority population (.5139); Fairfax, a large, diverse suburban county (.6532); and Halifax, a rural county (.3038).
School construction grants, $500 million in FY 2023. This is a one-time initiative of Governor Northam. The funds can be used for nonrecurring costs related to construction, renovation, modernization of equipment, and debt service payments on school projects completed during the last year. The budget bill states only that the funding is for “grants.” According to Attachment B of the Dec. 17, 2021, Superintendent’s Memo , DOE has decided to distribute the funding by formula: a minimum $1 million allocation, with the remainder distributed on the basis of weighted average daily membership (ADM). There is no required local match.
Distribution of School Construction Grants
- Richmond–$6.2 million
- Fairfax–$32.9 million
- Halifax–$2.6 million
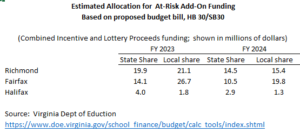
At-risk Add-on, $448.3 million (FY 2023); $328.5 million (FY 2024). Technically, this item is split-funded, with $108 million of the FY 2023 total and $99.2 million of the FY 2024 total coming from lottery proceeds (see category below). However, they are combined here in order to present the total scope of the program. This funding is additional basic aid to support programs for students who are economically and educationally at risk. The funds are distributed via a fairly complex formula based on the numbers and concentration of federal free lunch participants. Localities must match the funds, based on the composite index.
The Incentive Program appropriation from the general fund proposed by Northam for each year for the At-Risk Add-on category in the next biennium is a significant increase over the amount provided in this category in FY 2022. For FY 2023, it is a 130% increase and for FY 2024, a 55% increase.
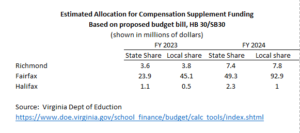
Compensation supplement, $247 million (FY 2023); $508.8 million (FY 2024). This pot of money is for the state share of a five-percent salary increase each year for funded SOQ instructional and support positions. The salary increases are not mandated, but those localities that choose to participate must match the state funding based on the composite index. Politically, and legally, of course, localities will have to provide the same salary increases to non-SOQ funded positions.
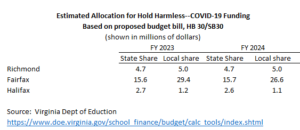
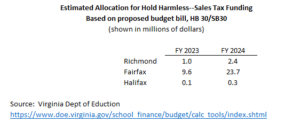
Hold harmless—rebenchmarking (COVID), $177 million (FY 2023); $177.4 million (FY 2024). Although “objective” formulas are used in numerous instances to distribute state aid to localities, legislators (and the Governor) are loath to allow the formulas play out fully if some localities stand to lose funding as a result of changes in their data inputs for the formula. In this case, the funding is being provided due “to unanticipated reductions in the base year rebenchmarking data” resulting from COVID-19 related school closings and virtual school settings. Localities must match the state funds based on the composite index.
Virginia Preschool Initiative, $117 million each year. This funding is intended for schools and community-based organizations “to provide quality preschool programs for at-risk four-year-olds who are residents of Virginia and unserved by Head Start program funding and for at-risk five-year-olds who are not eligible for kindergarten or who did not have access to a sufficient preschool experience.” The definition of “at-risk” is relatively broad and includes economic and educational criteria. In addition, “up to 15 percent of a division’s slots may be filled based on locally established eligibility criteria so as to meet the unique needs of at-risk children in the community”.
Funding for the program is based on $8,359 for each unserved at-risk four-year-old in the locality for a full-day program. Localities eligible for a cost-of-competing adjustment in the basic aid formula are funded at higher per-pupil rates. The state and local shares of the cost are determined by the composite index. However, localities may use expenditures for existing qualifying programs to meet up to 50% of their required match.
The proposed 2023-2024 funding, $117 million each year, for this program is about $10 million higher than provided in the current fiscal year.
Hold Harmless—sales tax on groceries, $45.5 million (FY 2023), $112.5 million (FY 2024). Under current law, revenue from one 1.125 cents of the sales tax imposed by the state is returned to localities to be used for education (This is discussed in Part 1 of this series.) Another $0.25 of state sales tax revenues are distributed to localities for specific educational purposes. If the elimination of the sales tax on food, proposed by the governor, is adopted, the amount of sales tax revenue returned to localities for educational purposes would be reduced. Accordingly, this item replaces the projected decrease in those sales tax disbursements. It is meant to be a one-time payment. Because a locality’s projected distribution of the state sales tax is subtracted from the total SOQ costs before applying the composite index to determine the state’s share of those costs, a decrease in the sales tax distribution would have the effect of increasing the amount the state would pay toward the SOQ costs. Therefore, the method used to distribute this hold harmless item is not straightforward. In short, it represents the net decrease after adjusting for the state’s increases in the share of the cost of Basic Aid resulting from decreased sales tax revenues. No local match is required.
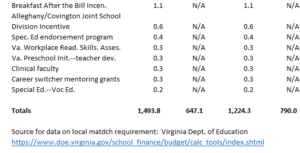
All the items in this category are shown below:
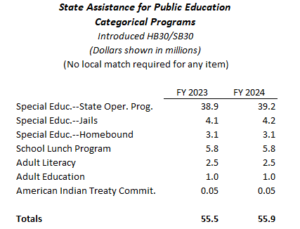
Categorical Programs
Categorical programs are usually targeted to particular needs of specific student populations. State and federal statues or regulations mandate much of the funding. Typically, there is no local match required. In each year of the next biennium, the budget bill provides a little over $55 million for this category.
The largest categorical program is special education for students placed in state-operated facilities, such as hospitals, clinics, detention homes, and the Woodrow Wilson Rehabilitation Center. Education services are provided through contracts with local school divisions and funding is based on caseloads. The budget bill provides $39 million annually for this program.
The Categorical Programs are;
Lottery Funded Programs
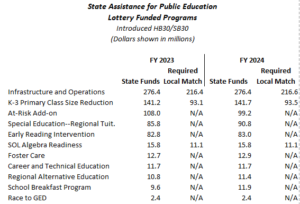
A 2000 amendment to the Virginia Constitution required that the net revenues of the Virginia State Lottery be distributed to localities for the purposes of public education. The amendment also prohibits localities from using lottery proceeds to cover their share of the costs of maintaining the Standards of Quality. However, the state does use lottery proceeds for the costs of two programs that are included in SOQ accounts: Early Reading Intervention and SOL Algebra Readiness. A total $746.7 million in lottery proceeds is provided each year in the budget bill for distribution to localities for education. (That annual amount is less than the revised estimate of $843.4 million for FY 2022, which indicates that the actual amount for the next biennium will be higher than the estimate shown in the budget bill.)
The largest Virginia State Lottery-funded programs are:
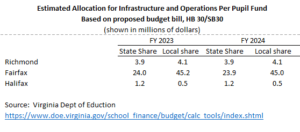
Infrastructure and Operations Per Pupil Fund, $276.4 million each year. his item is sort of a catchall that localities can use for whatever they wish. There are only two restrictions: (1) the funding cannot be used to supplant previous local funding and (2) localities can use no more than 60% for recurring costs, with at least 40% used for non-recurring expenditures.
The state allotment for each locality is based on the state’s composite index share of $407.41 per pupil, with each division receiving at least $200,000 annually. Localities are required to match the state funds, based on the composite index.
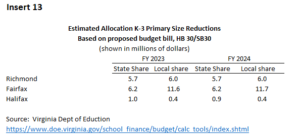
K-3 Primary Size Reduction, $141.2 million (FY 2023, $141.7 million (FY 2024). This pot of money is used as an incentive for localities to reduce K-3 class sizes below the SOQ standard of a 24:1 pupil/teacher ratio in schools with a relatively large percentage of at-risk students. Payments are based on the incremental cost of providing lower class sizes. Schools with a three-year average free lunch eligibility percentage of 30% or higher are eligible. The required ratios are 19:1 and may go as low as 14:1, depending on the free lunch eligibility rate of the eligible school. Localities are required to match the state funding, based on the composite index.
At-Risk. Split-funded with general fund appropriations and also included in the incentive category. See description above.
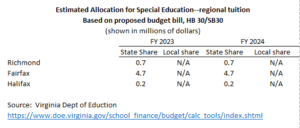
Special Education—Regional Tuition. $85.8 million (FY 2023); $90.8 million (FY 2024). Many children with “low-incidence” disabilities can be served more appropriately and less expensively in a regional setting than in more restrictive settings. Joint or single school divisions operate regional special education programs and accept eligible children from other local school divisions. The state reimburses the home school division the state share of approved tuition costs. Those students are not included in the locality’s ADM for other state-funded programs. Therefore, in effect, the localities are providing a match to the state funds from this program—the balance of tuition costs.
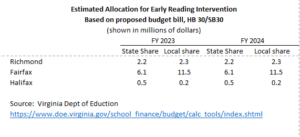
Early Reading Intervention, $82.8 million (FY 2023); $83.0 million (FY 2024). The purpose of this funding stream is to provide additional help to students in grades K-5 who have not performed well on reading tests. The funding is based on the cost of providing an additional 2.5 hours assistance per week to all eligible students at a pupil/teacher ratio of 5:1. The locality must provide its share of the cost, based on the composite index.
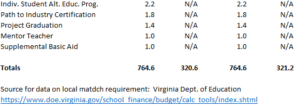
The total list of Lottery Funded programs follows:
The main sources for this article were:
- Overview of Virginia’s K-12 Funding Formula. Powerpoint presentation by Kent Dickey, Deputy Superintendent of Budget, Finance, and Operations. Found here.
- Various tables showing the distribution of aid by division, here.
- Item 137 of the 2022-2024 budget bill.
- Responses by VDOE staff to emails from me, asking questions and seeking clarifications.
Addenda:
In subsequent correspondence with DOE staff, I learned incidentally of a clarification I need to make to my earlier discussion of the Standards of Quality. The Early Reading Intervention and SOL Algebra Readiness programs, although funded with lottery proceeds, are part of the Standards of Quality. As a consequence, school divisions are required to provide these programs and provide their composite index share of the funding for them. Therefore, the SOQ table in the earlier post has been amended to include those programs.
My Soapbox: Because those two programs are part of the SOQ and required of localities, the state’s share should be provided through a general fund appropriation, rather than lottery proceeds.

