
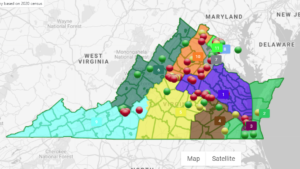
Congressional district map proposed by Va. Supreme Court special masters (The bubbles represent comments made by members of the public on Supreme Court interactive map)
by Dick Hall-Sizemore
The two special masters appointed by the Virginia Supreme Court to assist in redistricting have accomplished in about a month what the Virginia Redistricting Commission (“the Commission”) was unable to do in about nine months: produce single draft maps for the Congressional districts, the Senate districts, and the House of Delegates districts.
The draft maps and a long memo from the special masters explaining the process they used and the reasons for their recommendations can be found here.
An objective examination of the maps will lead to the conclusion that they are significantly more logical and sensible than the current maps or ones considered by the Commission. The districts are compact to the extent practicable and follow lines that make sense from a communities-of-interest perspective. There are no odd-shaped districts that really stand out. Any bulges or sudden incursions into adjoining districts are the result of the population equality requirement. Splitting of counties and cities is kept to a minimum.
One primary reason for this sensible outcome is the basic approach taken by the special masters. They used a “nested” approach. They first drew the Congressional districts. Then, as they explained, “to the extent practicable, we carved our Senate districts out of U.S. House districts … and then drew the House of Delegates districts out of Senate districts.” They went on to explain further, “We tried to adhere to drawing roughly 25 contiguous state House of Delegates districts within an area encompassed by 10 contiguous Senate districts, and, to the extent made possible by geographic constraints, we chose the Senate districts to represent areas of the state with similar communities of interest.”
There were three other considerations that contributed to the unusual shapes of the current map and over which the Commission debated at length which the special masters approached very differently: incumbency, race, and partisanship.
Incumbency
Protecting incumbents was a primary priority for the legislative members of the Redistricting Commission. Doing so led to some convoluted district boundaries. Here is the position taken by the special masters:
The Statutory Criteria make no mention of protecting incumbents. We therefore maintained ignorance about the residences of incumbents. Even as we submit these plans to the Court, we do not know which incumbents have been placed in districts with other incumbents, with one exception described below. We plan on maintaining that ignorance until the maps are finally approved, unless otherwise instructed by the Court. [Emphasis in original]
The one exception was an instance in which a research assistant pointed out that the proposed map placed two Black state senators in the same district They decided to keep the district as drawn because, “after some discussion, we concluded that the statutory guarantee is not to have particular incumbents elected, but rather the ability of minority groups to elect a candidate of their choice from a field of candidates.”
I have long thought that losing the ability to protect incumbents was the biggest fear that legislators had about kicking the redistricting process to the Supreme Court. Accordingly, I assumed that the legislators on the Commission would take whatever steps necessary to prevent that from happening. I was wrong and now their worst fears are going to happen.
As noted, the maps presented by the special masters do not show the districts in which two or more incumbents are placed. However, the Virginia Public Access Project (VPAP) has produced these maps, which can be found, along with some analysis, here.
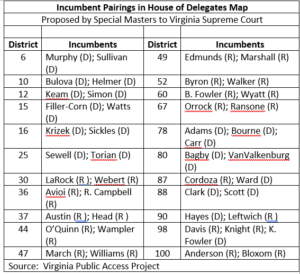
A lot of incumbents have been thrown into districts with other incumbents, according to the VPAP analysis. The number of districts and members affected indicate how the current districts were gerrymandered to protect incumbents. For the proposed 100 House districts, 22 will have more than one incumbent living within their boundaries (two districts will have three incumbents, including one with three Democratic incumbents). Forty-six delegates, almost half the body, will be affected: 24 Republicans and 22 Democrats. Twenty-four districts will not have an incumbent living within their boundaries.
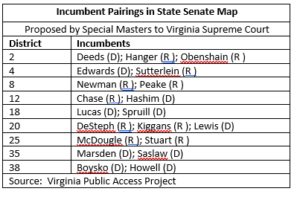
In the Senate, the story is much the same. Nine districts will be affected, with two of them having three incumbents each. Twenty Senators, half the total, will be affected, split evenly between Democrats and Republicans. There will be 12 open districts. The effect of these pairings would be somewhat mitigated by the expected retirements of Senators Newman, Howell, and Saslaw.
The following tables show the expected pairings of incumbents. Most of the pairings are of incumbents from the same party, which could result in a lot of primary elections. Of course, some incumbents could choose to retire or move to an open district. For those familiar with the General Assembly, there are some interesting pairings. Some of the Republican “incumbents” were first elected in last month’s election and have not yet taken office. That must be a real bummer: to not even have taken office, knowing you may have to face an incumbent with more experience in a primary election this spring! The legislative careers of some of these newly-elected Republicans could be short-lived.
For the U.S. House of Representatives, there are a couple of districts that will be significantly affected.
The First District, which is based in the Northern Neck and Middle Peninsula, but also includes the Fredericksburg area and much of Prince William County, has been shifted away from those northern areas and extended more westward to include western Henrico, Goochland, Louisa, and part of Fluvanna counties. As a result, Rep. Abigail Spanberger (D) will be in the same district as Rep. Rob Wittman (R), the current First District incumbent.
On the Lower Peninsula, Rep. Bobby Scott’s (D) Third District has been extended across the water to include Norfolk, Portsmouth, and part of Chesapeake. That new district would also be home to Rep. Elaine Luria (D), the incumbent in the current Second District. In the western part of the state, technically the Sixth District would have two Republican incumbents and the Ninth District would be an open district (as it is currently). Rep. Morgan Griffith (R) has represented the Ninth District since he was elected to Congress, although he does not live in the district. (The law does not require a member of Congress to reside in the district in which he was elected.)
There will be two open Congressional districts: the newly drawn Second District which Luria now represents and the Seventh District, which has been moved away from Spanberger’s Richmond base to include the City of Fredericksburg and Stafford and Prince William counties.
Race
The approach taken by the special masters regarding the racial makeup of the districts is likely to the be most controversial aspect of their work.
The members of the Commission spent many hours arguing over the representation of minorities, particularly Black populations. They were particularly intent on not having fewer minority-majority districts than currently exist.
In their report to the Supreme Court, the special masters acknowledged the requirements of the 14th Amendment and the Voting Rights Act, but they also emphasized the U.S. Supreme Court’s “repeatedly [holding] that the use of race in drawing legislative districts can trigger strict scrutiny.” Accordingly, they said, “To avoid this question, we simply drew districts without race as the predominant interest.” They used the traditional criteria, population equality, contiguity, minimization of splits in counties and cities, and compactness. They considered race only after a map had been fully drawn using these criteria.
The special masters admit that their maps do not have as many minority-majority or Black majority districts as the current maps do. However, they argue that is the “incorrect inquiry under both Virginia and federal law.” Rather, “the emphasis is upon districts where minority groups would have the ability to elect their candidates of choice.” They conclude by declaring, “we believe we have provided maps that do at least as well or better as the current map in terms of creating districts where the minority community has a realistic opportunity to elect a candidate of choice, while at the same time creating plans that are far superior in terms of limiting county and city splits and in terms of vastly improved compactness.”
It seems that there was only one instance in which the racial composition of a district took precedence. In drawing the Fourth Congressional District, they originally considered a compact district encompassing Richmond and the counties of Henrico and Chesterfield. However, they concluded such a district would dilute the Black vote in violation of statutes and court decisions. Therefore, they recommended a district that closely resembles the current Fourth District, stretching from Richmond south to Greensville County on the North Carolina line. A secondary effect of this decision would be the splitting of the Richmond area between three Congressional districts: the First, Fourth, and Fifth.
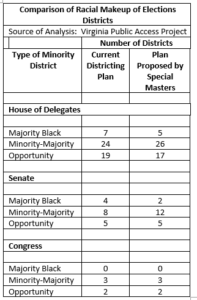
Based on the VPAP analysis, the table below shows the racial breakdowns of the proposed plans, compared to the current district maps. Some definitions are in order:
- Black majority—the voting age population is more than 50 percent Black.
- Minority-majority or coalition—Any combination of racial minorities (Black, Hispanic, Asian, etc.) constitutes 50 percent or more of the voting age population.
- Opportunity—Non-whites or Hispanics constitute between 40 and 50 percent of the voting age population.
Partisanship
State law requires that redistricting maps not “unduly favor, or disfavor, any political party.” As a result, the members of the Commission spent much time examining the perceived political leanings of almost every district. For each map considered, there was a partisan breakout of each district, based on recent election results.
Rather than test each district, the special masters looked at the maps as a whole. As the report explains,
“once the maps were drawn, we examined the political data in their totality, with particular attention to the median district. Our rough goal was to see if the median district in a Congressional map approximated Joe Biden’s and Donald Trump’s statewide vote shares for 2020, and if it approximated the Democrats’ statewide results for 2017 for state legislative districts. … It was our agreed-upon understanding, however, that since the standard asked that maps not “unduly” favor one party or the other, we would leave the maps in place unless the results were both (a) truly egregious and (b) able to be remedied while adhering to the other criteria above.” [emphasis in original]
The special masters’ conclusions regarding the partisanship aspect of each of the maps is set out below. Also included is the VPAP analysis of the partisan leanings of the proposed maps. It needs to be noted that, in assessing the partisan leanings of the districts, VPAP used the results of the 2016 Presidential election, while the special masters used the results of the 2020 Presidential election and the results of the 2017 election for Attorney General.
Congress
Special masters—“In a very good Republican year, Republicans could win a majority of the seats in Virginia. Generally, we would expect to see a 6-5 Democratic edge in Virginia’s delegation. In very good Democratic years, Democrats might perhaps achieve the same 7-4 advantage that they now enjoy…Overall, this map is well-balanced, does not unduly favor any party, and does not require further adjustment.”
VPAP—Each party would have 5 strong or moderately strong districts, with one swing district.
State Senate
Special masters—Based on the results of the 2017 statewide Attorney General race, Democrats would be favored in 23 of the 40 districts. However, because the Democratic winning percentages in the two median districts were only slightly over 50 percent, the special masters concluded that “each party will have to win an election in ‘unfriendly’ territory in order to control the state senate.” Therefore, they contend, the map does not unduly favor either party and needs no further adjustment.
VPAP—Based on the results of the 2016 Presidential election, currently 21 districts strongly or moderately lean Democratic and 17 lean strongly or moderately Republican, with two swing districts.
Under the proposal, Republican strength would remain the same, while Democrats would pick up one strong district and there would be only one swing district.
House of Delegates
Special masters—They conclude that the map gives Republicans a slight advantage, which they attribute to Virginia’s political geography. As they put it, “Although Republicans may find it slightly easier to win a majority, Democrats will have a tendency to enjoy larger majorities when they win.” They found that the map did not unduly favor either party and needed no adjustments.
VPAP—Rated the current map as having 47 districts that lean strongly or moderately Democratic and 41 that lean Republican, with 12 swing districts. Under the proposed plan, there would be 49 strong or moderate Democratic districts, 41 Republican, and 10 swing districts. (The results of the 2021 General Assembly elections were not used because the data broken down by precinct was not yet available.)
Conclusion
All in all, this was a remarkable accomplishment. If the report to the Supreme Court is to be believed, the two special masters, one appointed from a list provided by Democrats and one appointed from a list provided by Republicans (after the Supreme Court had rejected the first list submitted by Republicans), got along famously. As they reported to the court, “These maps reflect a true joint effort on our part. We agreed on almost all issues initially, and the few issues on which we initially disagreed were resolved by amicable discussion.” This is in sharp contrast to the obvious distrust frequently displayed by the partisan map drawers used by the Commission.
The Supreme Court will hold virtual public hearings on December 15 and 17. In addition, members of the public may submit written comments and enter comments directly on the interactive maps.
After all the comments are reviewed, the Supreme Court will make any adjustments to the maps that it feels are warranted and then release the maps and boundary descriptions, which will be final.
The only question remaining to be decided is whether the first elections for the new House districts will be in 2022 or in 2023, when they would regularly be held. That question is the subject of a case pending in federal district court. Whenever the next elections for the House and Senate are held, it is guaranteed that the membership in both chambers will be considerably different than it will be during the 2022 Session.
The scrambling has already started for the 2022 Congressional election, especially in the new Seventh District.

