
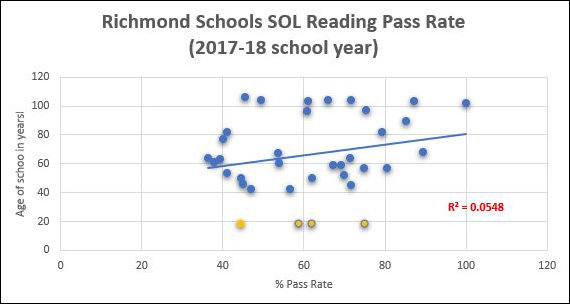
This graph shows the low correlation between the age of the school and English SOL pass rate of the students.
City of Richmond Mayor Levar Stoney celebrated yesterday the planned construction of new school buildings to replace three of the city’s oldest, most decrepit facilities, reports the Richmond Times-Dispatch. With money raised from a hike in the meals tax, leveraged to issue $150 million in bonds, the city will build new structures for George Mason Elementary (96 years old), E.S.H. Greene Elementary (63 years old), and Elkhardt Middle School (77 years old).
There is understandable revulsion at the disgraceful physical condition of the city’s older schools, some of which have rat droppings, leaking roofs, broken sinks and toilets, and malfunctioning heating/cooling systems. Over and above conducting emergency repairs to bathrooms, the city has committed to a $225 million, 44-school modernization program over the next three decades.
An assumption underlying the plan is that there is a strong relationship between the physical condition of a school and the quality of educational outcomes.
One can readily agree that every school should meet certain minimum standards — no leaks, no rats, no broken toilets, functional heating systems — no matter what. But will the construction of new schools — as opposed to remedying the obvious deficiencies — do anything to help Richmond students do better at reading, writing, math, and science? I have seen no indication that anyone is asking that question.
I made a stab at finding an answer by correlating the age of Richmond city schools with average English Standards of Learning pass rates. The data is incomplete and imperfect — the best I could cobble together in a couple of hours of blogging — and should be seen as no more than an illustration of the kind of analysis that could be done.
I took the age of the schools from a 2004 School Efficiency Review. Several new schools have been built since then, and I haven’t found an online source identifying which ones, so that data would have to be updated. The SOL scores come from the Virginia Department of Education’s Build-a-Table database. I also threw out a handful of schools with only partial SOL data. The result is the scattergraph above,which shows a very low correlation between the age of the school and SOL scores.
Of particular interest are the four yellow dots at the bottom of the graph. They are relatively new schools, only 19 years old. Hence, we can assume they are in good condition compared to the older schools. The average English SOL pass rate for the school district as a whole was 58.9%. The pass rates for the four newer schools were:
Blackwell Elementary — 44.4%
Miles Jones Elementary — 58.7%
Linwood Holton Elementary — 74.8%
Lucille M. Brown Middle — 62.0%
Average pass rate for all four: about 60%. That’s barely better than the school district as a whole.
To repeat, these results can be regarded only as illustrative of the kind of analysis that is possible. To draw hard conclusions, the average-school-age data would have to be updated.
But let’s assume, for purposes of argument, that current data would show similar results. If pumping money into brand, spanking new physical facilities yields little in the way of improved outcomes, we need to ask what else could be done with the money. What is the alternate opportunity cost? Could the city pay teachers more? Could it reward good teachers? Could it reduce average class sizes? Could it hire more special ed staff?
A 2015 Facilities Task Force reported to the Richmond School Board that a community survey found that 46% of those who responded said that school facilities impacted the learning environment “unfavorably” or “very unfavorably.” That was as close as the task force got to probing the relationship between school facilities and educational outcomes. The survey may have captured prevailing popular sentiment based in part upon negative news stories about Richmond city schools, but it offered no hard data. From an analytical perspective, it was worthless.
In a recent review of the academic literature, C. Kirabo Jackson found the following:
As a whole, studies on the impact of capital spending in different states is mixed. Of the 7 studies identified, four are positive and three are null impacts. The fact that none were negative suggests that the average impact of capital spending is positive but that there may be considerable heterogeneity in that impact (and it may be zero in many cases).
While new school construction might contribute marginally to educational outcomes, Jackson did not address alternative uses of the money.
If the City of Richmond is going to raise taxes in order to build new schools, it’s got to provide a better justification than what we’ve seen so far. The same can be said of virtually every other Virginia school district, and of Governor Ralph Northam’s budget proposal to boost teacher salaries 5% in the next biennium. What impact will these investments have on educational outcomes compared to other potential investments? We don’t know. We’re just throwing money around on hunches and guesses.

