A month ago I demonstrated in “The Big Lie of Unequal Funding” that there is no meaningful difference on average in the amount of money spent on black and white school children between school districts across Virginia. I drew that conclusion based on average spent per pupil in each school district. The comeback from those who want to believe that systemic racism exists is that while spending may be equal on average across school districts, spending might well be unequal within school districts. In other words, I did not prove that school districts didn’t discriminate against blacks by funneling more money to individual schools in whiter, more affluent neighborhoods.
It so happens that the Virginia Department of Education has just updated its School Quality Profiles, and it provides numbers for spending per school. We can now test the proposition that Virginia school boards discriminate on the basis of race by funding white schools more than black schools.
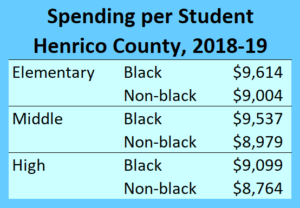
I have just run the numbers for Henrico County, my county of residence, and I conclude conclusively, that, yes, Henrico schools do discriminate. They spend more, on average, on black students than other students. Henrico elementary schools spend 6.8% more on blacks than non-blacks, 6.2% more in middle schools, and 3.8% more in high schools.
It is axiomatic among liberals and progressives that predominantly black schools are under-resourced while predominantly white schools are newer, shinier, have more experienced, higher-paid teachers and in many other ways benefit from white privilege. While Henrico County is just one school system, it is large, ethnically diverse and to some degree representative of the state as a whole. Based on the VDOE data, we can say that in at least in this instance, the Oppression Narrative is totally wrong. It has no factual foundation.
Is Henrico the exception or the rule? I invite readers to follow my methodology for their own school systems and submit their findings. I will publish them.
Let me explain my methodology. If you find it deficient, please explain. If I find your objections to be well founded, I will make the necessary adjustments.
- First, I recorded in my spreadsheet the VDOE figure for total spending per school, as found in its School Quality Profiles.
- Second, I calculated a per-pupil expenditure for each school, based on the most recent enrollment figure provided in the VDOE database.
- Third, I downloaded the number of black students and non-black students. (Non-black includes whites, Hispanics, Asians, and others.)
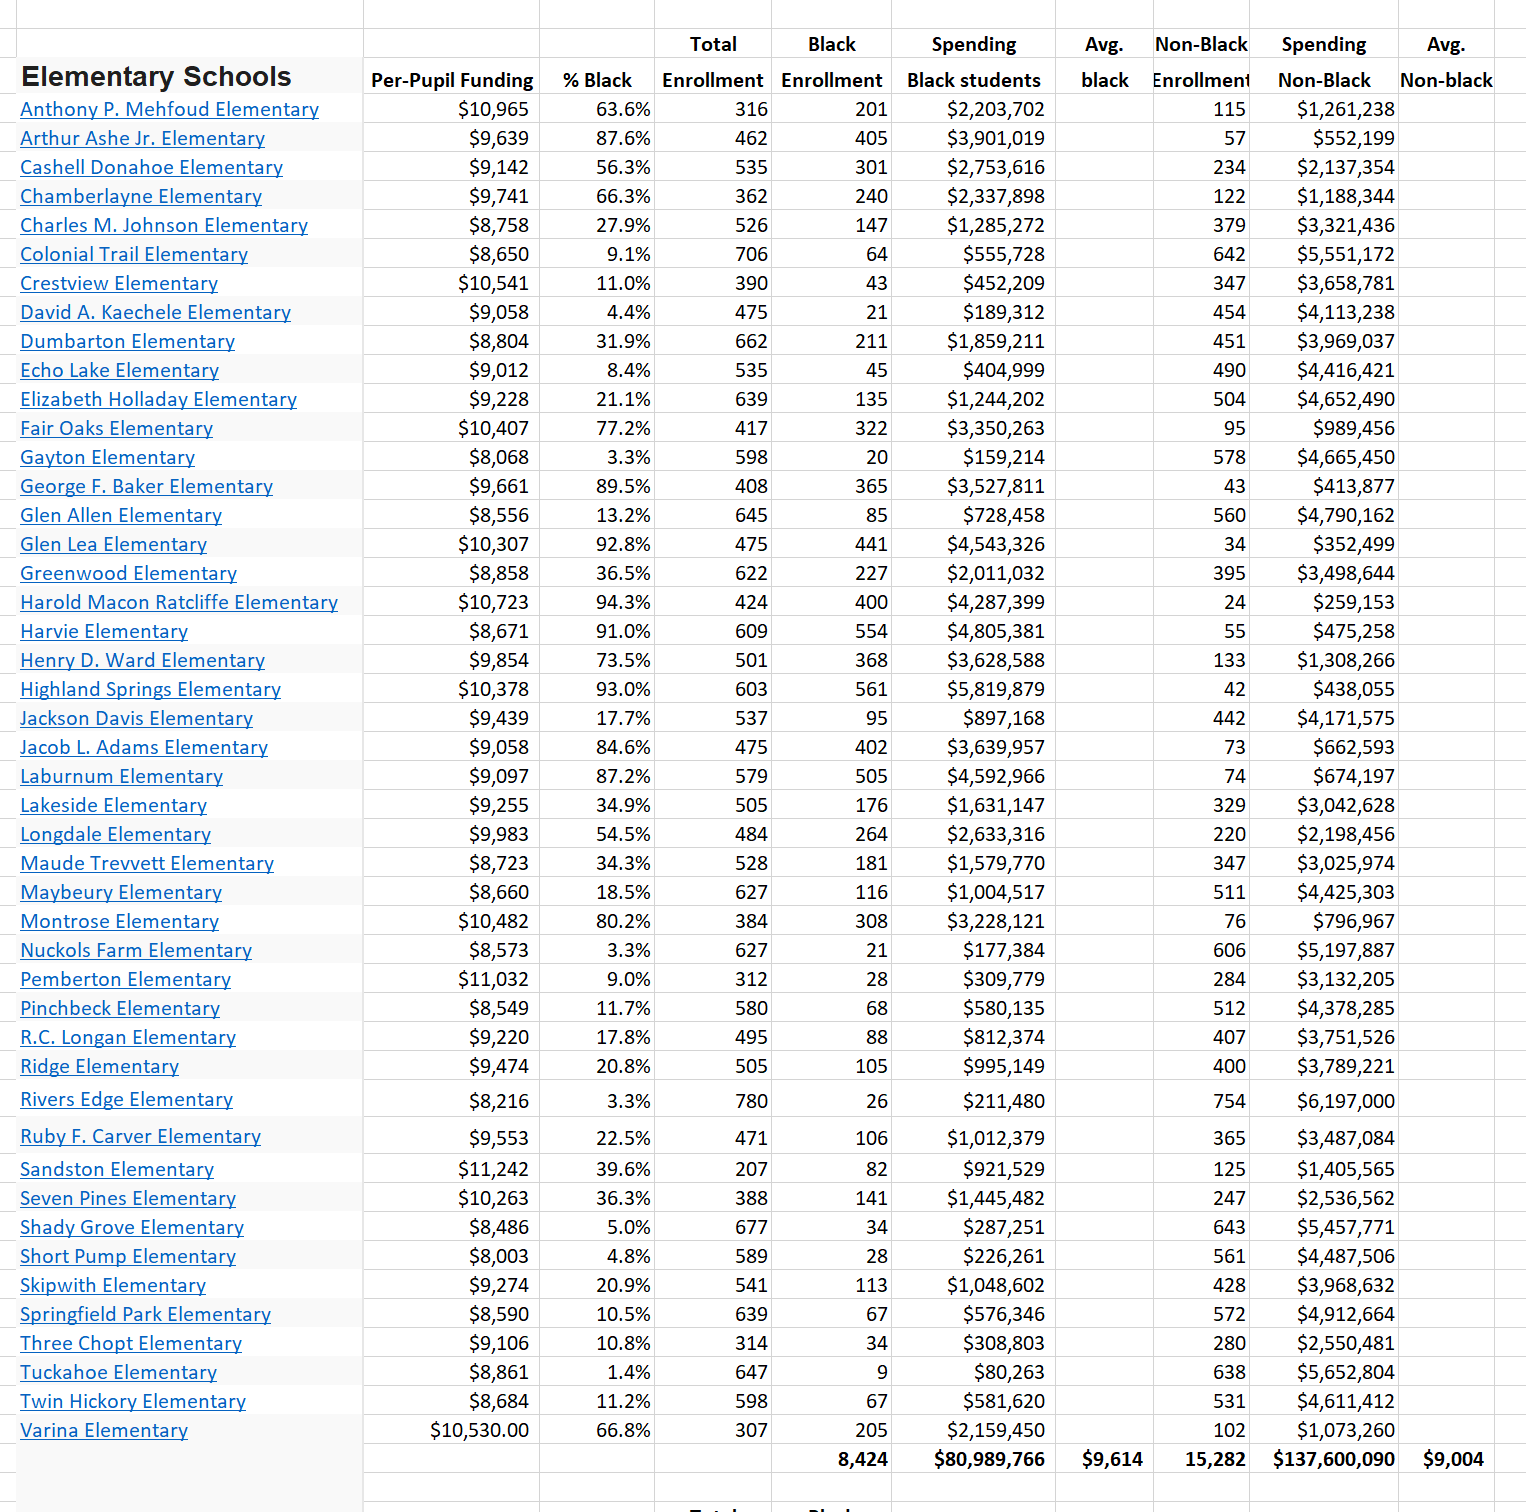
- Fourth, I multiplied the per-pupil spending at each school times the number of black students, and the number of non-black students, to derive a total spending for blacks and non-blacks at each school.
- Finally, I added up the black and non-black expenditures for all elementary schools, all middle schools, and all high schools, and then divided the total spending by the number of students in each group to drive an average spending per pupil for both blacks and non-blacks.
While there are exceptions, two generalities hold true in Henrico County: (1) The district spends more per pupil at predominantly black schools and (2) less per pupil at predominantly non-black schools.
Here is the breakdown by school. Click to see larger, more legible images.


