by James A. Bacon
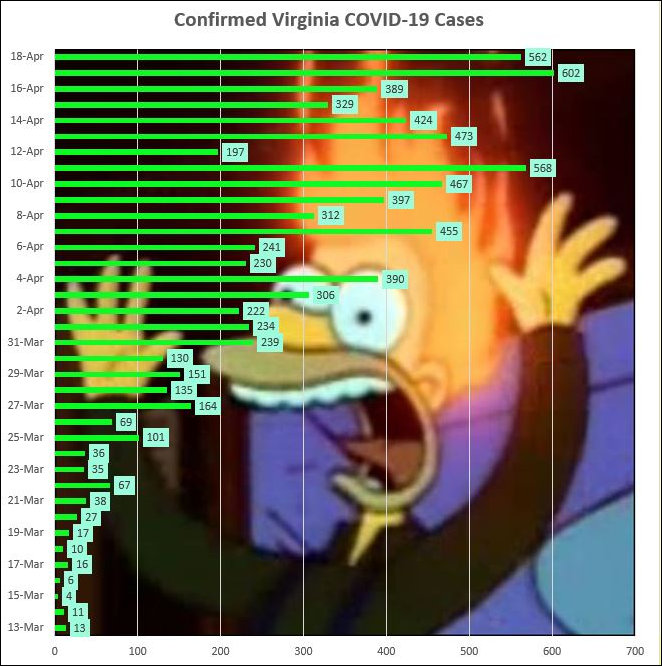
The latest Virginia Department of Health (VDH) data continues to look alarming: 562 new reported cases yesterday, 75 new hospitalizations, and 27 new deaths. However, I’m sticking by my argument that the epidemic in Virginia is close to peaking. Here’s the nub of my argument, the number of confirmed COVID-19 cases is bifurcating from other data sets measuring the spread of the disease. I am questioning whether it is even a meaningful figure anymore.
Steve Haner has pointed me to an ABC News article which makes the point that COVID-19 infection is far more prevalent than indicated by officially recorded tests. Recent community testing in Santa Clara County suggest that the actual number of infections is 50 to 80 times higher than the original numbers. A Wall Street Journal op-ed today makes the same point.
If those same ratios apply to Virginia, the number of actual COVID-19 infections, as opposed to officially confirmed infections, could stand around 400,000 to 500,000. Of those, fewer than 1,300 have been hospitalized and only 258 have died. Those are tiny percentages, not much different from a typical influenza season. The bifurcation in trend lines can be seen in this graph showing new confirmed cases, hospitalizations and deaths reported by the VDH:
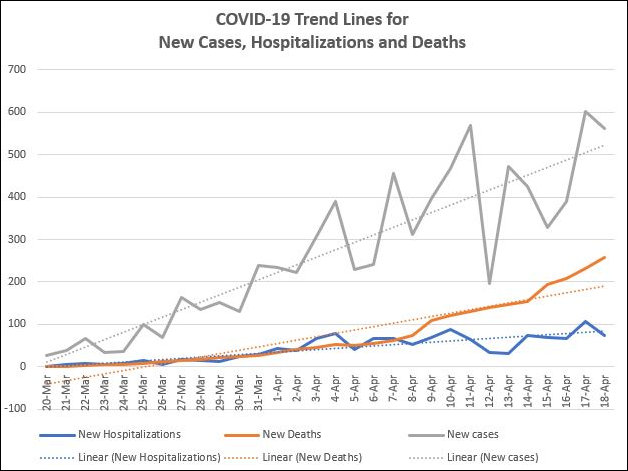
The number of reported cases is increasing far more rapidly than the number of hospitalizations and deaths.
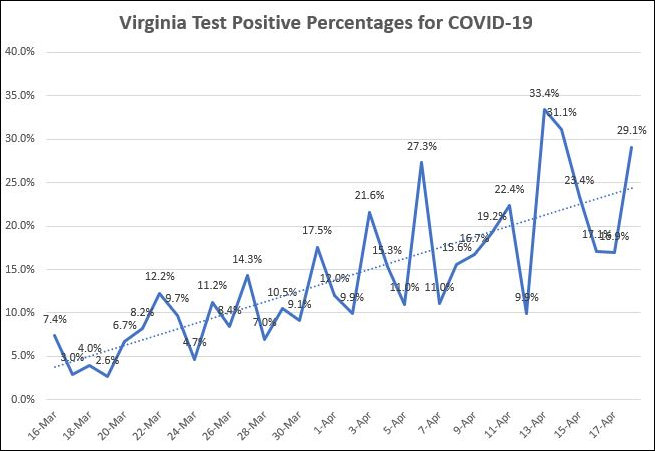
Rather than providing an accurate measure of the spreading of the disease, I would suggest, the number of new cases is an indicator of Virginia’s healthcare providers ability to target their tests. In the early phases of the epidemic in Virginia, testing was scattershot. The number of negative results was extremely high. Doctors and nurses were testing a lot of people who did not have the virus. But as healthcare providers got better at recognizing systems, and as they prioritized patients they deemed most likely to have the disease — typically those who were in the hospital already — the percentage of “hits” has increased over time. You can see that trend in this graph, which expresses the new COVID-19 confirmed cases as a percentage of the number of tests on a given day.
If the official number of COVID-19 cases reflects one out of 50 cases in the real world, it is almost worthless as an indicator of how rapidly the disease is spreading through the population. What better measures are there? The number of hospitalizations and deaths. Those data series have their own issues, but we can feel pretty confident that they are a more accurate reflection of trends than the confirmed- cases number, especially trends among those most severely affected by the disease.
We can tentatively draw important conclusions to guide us as we seek the appropriate balance between saving lives and salvaging the economy:
- The disease has spread far more rapidly than anyone heretofore suspected;
- It is not not nearly as fatal as feared;
- Social-distancing measures have indeed “flattened the curve” and Virginia hospitals are in no danger of being overwhelmed, and
- There is far more herd immunity in the population than previously believed.
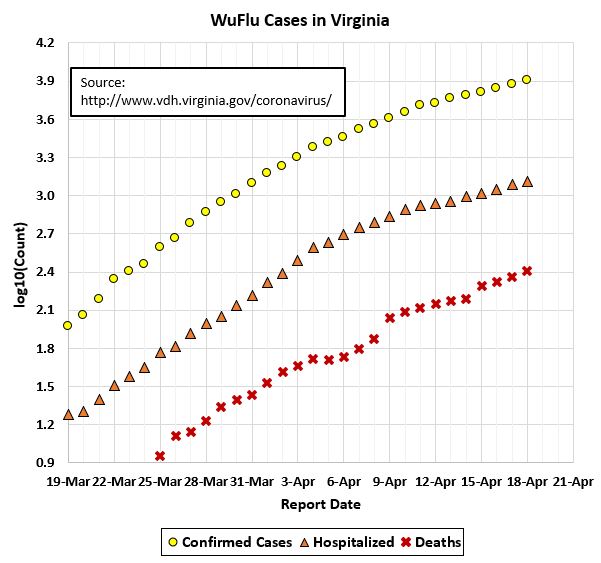
I conclude by presenting John Butcher’s updated logarithmic graph that shows a bending of the curve for the three key metrics.