
by James A. Bacon
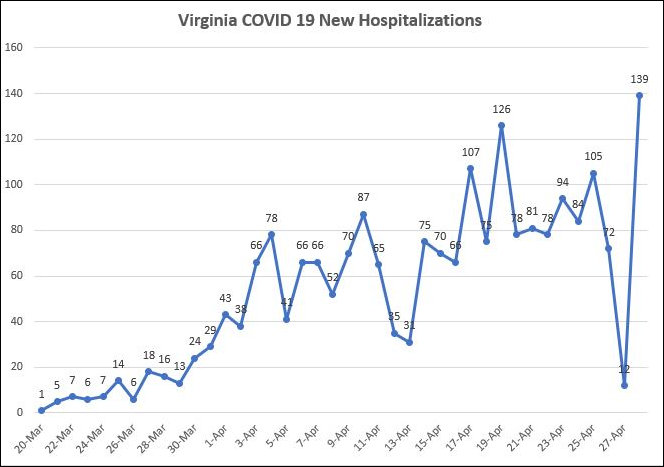
New COVID-19 hospitalizations in reported in Virginia yesterday shot up to a high of 139, but the spike came after a month-long low of 12 the previous day. It is reasonable to conclude that what we’re seeing is an artifact of data collection and reporting, not a reflection of the real world progress of the virus. If we average out the two days, we get an average of 75 each day, which is consistent with my contention that the spread of the virus has leveled off. The epidemic in Virginia not retreating, but it has leveled off.
Consistent with the new hospitalizations data from the Virginia Department of Health, we can see from Virginia Hospital and Healthcare Association (VHHA) that utilization of ICUs and ventilators are down. COVID-19 patients in ICUs hit a new low — 376, down from a peak of 469 — since the VHHA began reporting the data in early April. Likewise, the number of patients on ventilators remained at 217 for the third straight day, also the lowest reported.
As I have noted many times, the reported number of new confirmed cases of the virus is virtually worthless as an indicator of the progress of the disease. The number reflects the number of tests conducted, the protocols followed, and reporting delays far more than the prevalence of the virus.
Now, a more pessimistic presentation of the data from my collaborator in statistical malfeasance — OK, OK, I, not he, am the one guilty of statistical malfeasance — John Butcher:
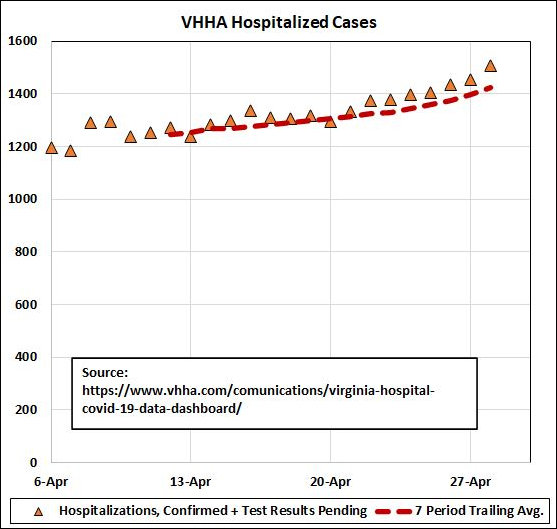
By John’s reckoning, the number of total hospitalizations is clearly trending up. It just goes to show, you can take any set of data and present it in different ways to reach different conclusions. Pick the presentation that best suits your prejudices.
Meanwhile, we offer for your data delectation this chart from another collaborator, Carol Bova, which highlights the mismatch between the VDH new hospitalization numbers and the VHHA discharge numbers.
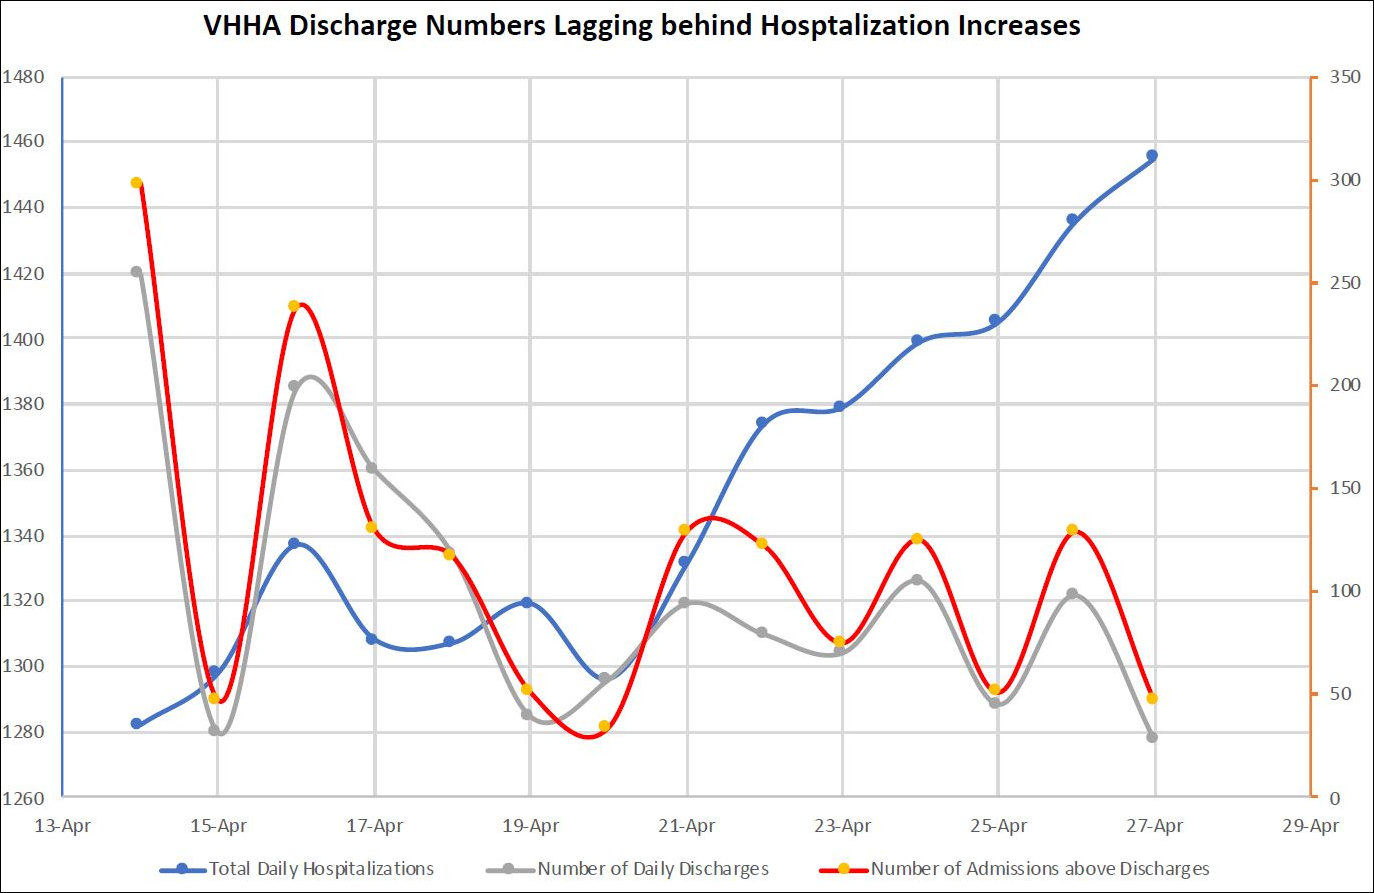
One would predict that the number of discharges would roughly match the number of admissions following a n approximately two-week treatment period (the average length of hospital stays for COVID-19 patients). In other words, if 100 patients go in one day, and they get treated for two weeks on average, then one would expect 100 (minus the handful who died) on average to be discharged two weeks later. There would be small daily variations, of course, but over time minor fluctuations would average out.
But that’s not what we’re seeing. While the number of new hospitalizations has trended higher, the number of discharges is lower than it was two weeks ago. Two possibilities present themselves: (1) We’re seeing changes in how and when these statistics are reported, or (2) there is a change in real-world behavior, and hospitals, for whatever reason, are hanging onto their patients longer.
We’ll delve deeper into this conundrum in another post.

