
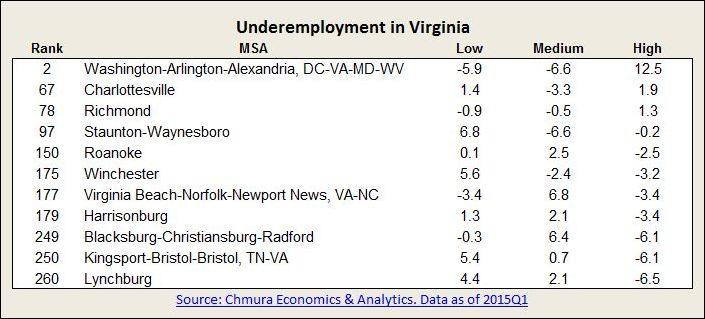
Source: Chmura Economics & Analytics. Positive numbers represent the degree to which supply exceeds demand for three levels of educational attainment. High = B.A. or higher. Medium = Associate’s degree or some college. Low = high school graduate or lower.
by James A. Bacon
It is common knowledge that the official United States “unemployment” figure needs to be taken with a grain of salt. It does not include discouraged workers who have dropped out of the workforce. It does not reflect the increase in part-time employment, some of it involuntary. And it does not reflect underemployment in which Americans work in occupations beneath their level of educational qualification.
My friends at Chmura Economics & Analytics have developed a fascinating technique for measuring under-employment by comparing educational attainment with the skill requirements demanded by the region’s occupational mix. It’s not perfect, as the Chmura team is the first to acknowledge. But it provides a defensible estimate of the amount of slack in the economy nationally, and in each of the U.S.’s 381 metropolitan statistics areas (MSAs).
The underemployment number is a two-edged sword. On the downside, the higher the level of underemployment, the greater the extent to which the nation’s (or a region’s) human capital is not being put to work. Just as investment in buildings, capital equipment and infrastructure represents economic waste if it is under-utilized, it is an economic waste if human capital is under-utilized. As Chmura puts it, “Workers who are underemployed and not necessarily contributing as much as they could to the labor market, represent potential lost productivity, wages, and tax revenue for the region.”
Ironically, underemployment tends to be higher in MSAs with the higher-performing economies, such as Washington, San Francisco, Boston, Raleigh and Boulder, Colo. Why would that be? Perhaps, Chmura suggests, it’s because these are MSAs are desirable places to live where workers are willing to trade off the full utilization of their skill sets in exchange for lifestyle amenities. Thus, the MSA with the highest underemployment in the country turns out to be Barnstable Town, Mass., with its scenic Cape Cod waterfront.
On the upside, a high underemployment rate can be an economic development bonus — it represents a deeper labor pool available to new employers than is evident in the unemployment number alone. If under-employed workers can be to work utilizing their most remunerative skills, they can give a big boost to a regional economy.
To my mind, the most remarkable figure in the table above is the high level of underemployment for higher educated workers in the Washington metro. Does that 12.5% under-employment mean that, even after factoring in higher housing prices and hideous traffic congestion, better-educated employees consider Washington to be a more desirable place than anywhere else in Virginia to live and pursue a career? Perhaps. It also could reflect momentary slack in the labor market due to sequestration-related cuts in federal spending. Perhaps the economy hasn’t been depressed badly enough or for long enough to drive people away.
Either way, the Chmura data provides considerable insight and raises lots of fascinating questions.

